Ask ten traders what timeframe their bot should run on and you will get ten confident, contradictory answers, and most of them are actually answering a different question. A timeframe is not a speed setting. It is the size of the candle every indicator in your strategy gets computed against, and switching from 1-hour to daily does not make your bot faster or slower. It changes what counts as signal and what counts as noise. Pick the wrong one, and a rule that backtested beautifully will spend real money reacting to candles that were never going to hold.
I run TradeArmor on a machine in my own house, a self-hosted crypto trading platform built around built-in BTC/USDC signals with a three-year live history, 15 indicators computed locally in real time, a plain-English AI strategy builder, and DCA, grid, futures, copy trading, backtesting, paper trading, and tax exports on the same engine. Every one of those pieces runs on whatever candle interval you point the strategy at, which is exactly why timeframe is the first setting that quietly decides whether the rest of your rules ever get a fair test.
What "Timeframe" Actually Controls
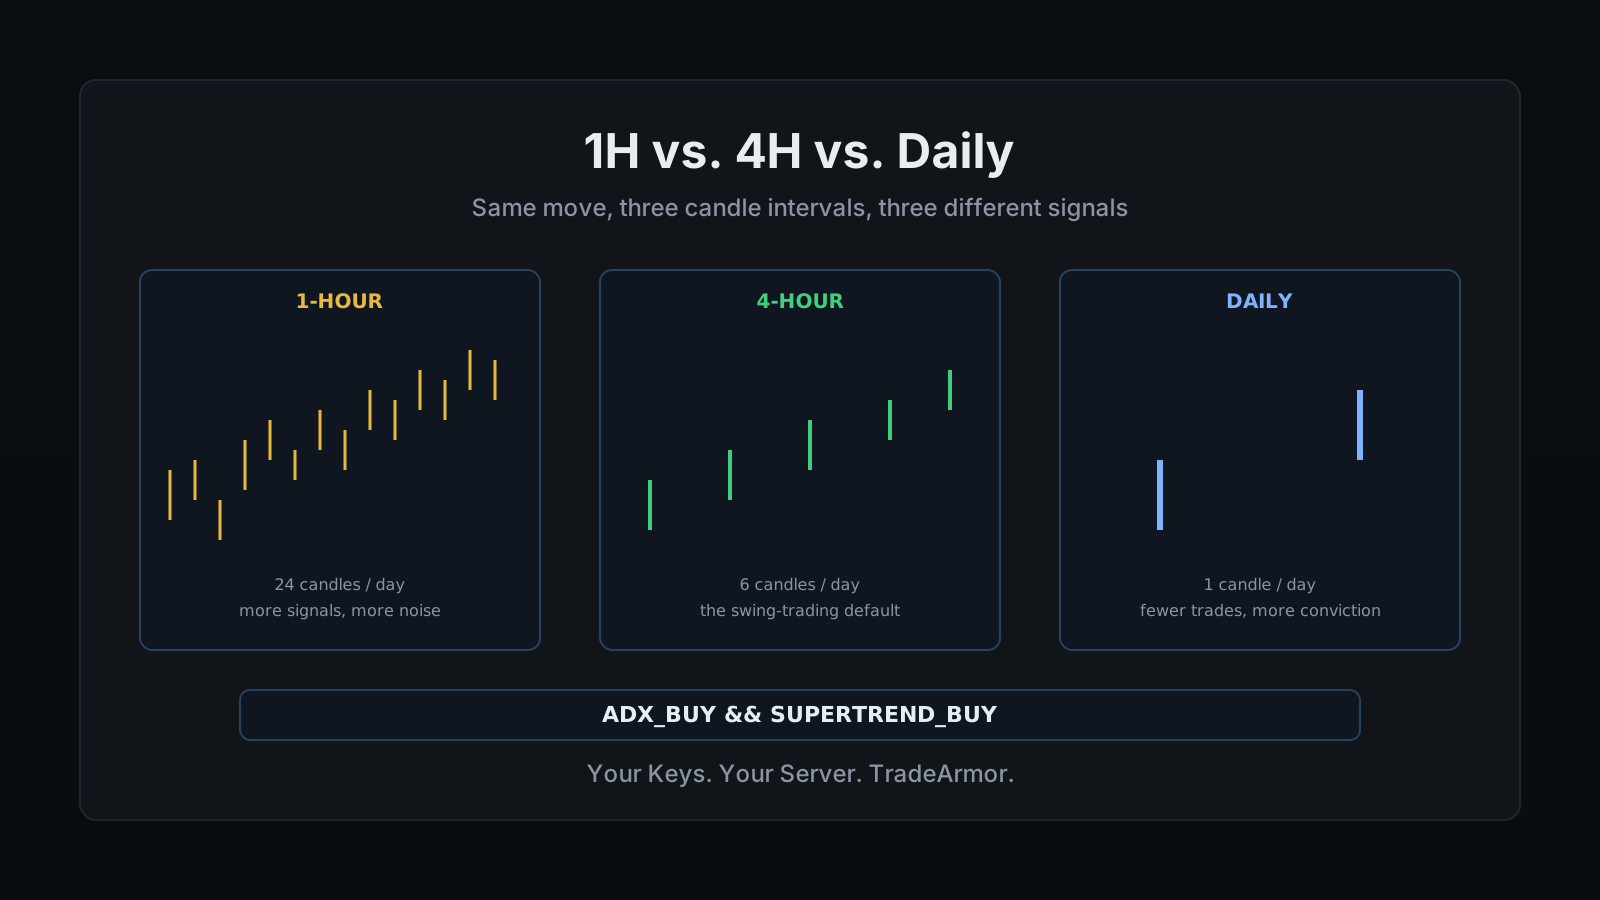
A candle is a fixed slice of time: open, high, low, close. A 1-hour candle closes 24 times a day. A 4-hour candle closes six times. A daily candle closes once. Every indicator your bot runs, RSI, MACD, ADX, Supertrend, whatever's in the formula, recalculates on the close of whichever candle it is watching, so a 14-period RSI on a 1-hour chart is a completely different number than a 14-period RSI on a daily chart, even at the exact same moment, because it is averaging a different 14 slices of time. Our guide to how crypto trading bots work covers the rest of that execution loop, from signal to order, if you want the full mechanic before narrowing in on timeframe alone.
This is separate from how often your bot checks the market. TradeArmor's dashboard refreshes in real time, and the engine can poll continuously, but a strategy built on 4-hour candles only acts on a 4-hour close. Faster polling does not make a slow timeframe strategy trade more. It just means you find out about the last close sooner.
The 1-Hour Chart: More Signals, More Static
A 1-hour interval hands you 24 fresh reads a day. That is appealing if you like watching the bot work, but it also means 24 chances a day for a whipsaw candle to trip an entry that reverses an hour later. Traders who genuinely want a high trade count, or who are running a hybrid strategy where cava-signals are filtered by a fast indicator, lean here on purpose. Everyone else backs into it by accident, usually because a shorter interval feels like it is doing more, when what it is actually doing is generating more noise for the same amount of real trend.
The 4-Hour Chart: The Swing-Trading Default
Six candles a day is enough resolution to catch a multi-day swing without drowning in every intraday twitch, which is the exact trade-off that made 4-hour the interval most swing-focused crypto strategies default to. It filters out the churn a 1-hour chart reacts to while still confirming a move faster than a full day's wait. If you have a job that is not "watch candles," this is usually the first interval worth testing, because it produces a manageable number of decisions instead of an hourly stream of them.
The Daily Chart: Fewer Trades, More Conviction
A daily candle is slow by design. It takes 200 daily closes to build the 200-day SMA behind a classic golden cross, and that same slowness is what makes the signal worth trusting once it fires. Daily-interval strategies trade rarely, miss the fast reversals entirely, and are the closest thing to position trading a bot can run. They suit the BTC holder who wants the DCA engine spacing entries over weeks, not hours, and who would rather see one clean signal a week than twenty noisy ones a day.
Ready to see this on your own pair? Try the DCA Backtester and run the same rule across a few intervals before you decide which one earns real capital.
The Fee Math Nobody Backtests
Every trade pays a fee, usually a percentage of the order size, and that percentage does not care how big the move behind the trade was. A 1-hour strategy chasing a half-percent swing and a daily strategy chasing a five-percent swing can pay the exact same round-trip fee rate, but that fee eats ten times more of the smaller target. Trading costs shrink as a share of profit the longer the holding period gets, which is one of the quiet reasons higher timeframes are more forgiving for traders who are not actively managing slippage and spread on every single fill. Check your own exchange's maker and taker schedule before assuming a fast interval and a slow one cost the same to run.
Multi-Timeframe: Let the Slow Chart Gate the Fast One
The classic multi-timeframe read is a daily or weekly chart for trend, a faster chart for the actual entry. It is not, on TradeArmor or most retail platforms, a single formula evaluating two intervals at once. A boolean rule runs against the one candle interval its strategy is configured to use. The honest way to get the multi-timeframe discipline without pretending otherwise: backtest the rule on the slower chart first to confirm the trend it is riding is real, then run the live formula on the faster interval you actually trade, with a trend-strength filter doing the job of keeping the two reads in agreement:
ADX_BUY && SUPERTREND_BUY
That pair does not care which interval you point it at. Run it on daily and it is a conservative trend confirmation. Run it on 1-hour and it becomes a much noisier, much more active filter on the exact same logic, because the candles behind ADX and Supertrend changed, not the rule.
Choosing the Best Timeframe for a Crypto Trading Bot
Three questions settle it faster than any backtest will. How much time can you actually give to reviewing what the bot did, not watching it live, reviewing the log after the fact. How sensitive is your account size to fees, because a smaller account feels a 1-hour trade's costs more than a larger one running the same rule on daily. And how quickly do you want to catch a broken rule, because a 1-hour strategy that goes wrong compounds a bad week much faster than a daily one does. Every trading-bot ad promising more signals as a feature is quietly asking you to check the chart more often, not less.
Writing It as a Bot Rule
Pick the interval before you pick the indicators, not after. Configure the strategy on that candle interval, run it through the backtester across at least two intervals to see how sensitive the results actually are to your choice, and keep the exit rules honest about which interval they are reading too. A trailing stop built for daily candles will lag badly if the entry logic is firing off 1-hour closes, an ATR-sized stop recalculated on the wrong interval will size positions for volatility that has nothing to do with the trade you are actually in, and a take-profit rule built for a five-percent daily swing will exit a 1-hour trade far too late. The plain-English AI strategy builder will write the formula for you once you have settled on the interval, bring your own key, no markup on top of the subscription.
There is no universally correct timeframe, only the one that matches how much attention you actually plan to give it and how much of the move your fees are allowed to eat. Test the same rule on 1-hour, 4-hour, and daily before you trust any one of them with real capital, and let the backtester do the arguing instead of a gut feeling. TradeArmor runs every interval, every indicator, and every strategy mode on hardware you own, where the keys never leave the machine and one subscription replaces the stack of a charting tool, a signal service, and a SaaS bot. See the plans and get started.