"Show me the rules it's following, not just the result." That's the ask from a trader who watched a chart sit dead flat for three days and then rip eight percent in an hour, and wanted to know afterward whether the bot on their account would have caught it or slept through it. Ask the same trader about coding that setup by hand and you get the second line every time: they don't want to write Python strategies just to test whether a keltner channel strategy actually beats a hunch.
TradeArmor is the self-hosted crypto trading bot I run on a machine I own, not a subscription pointed at somebody else's server: a three-year live BTC/USDC signal record, 15 real-time indicators, a plain-English AI strategy builder, and DCA, grid, futures, copy trading, backtesting, paper trading, and tax reporting on one engine. This is a guide to what a keltner channel strategy actually measures, how it differs from the plain Bollinger squeeze, and how to turn the setup into a bot rule instead of a shape you're eyeballing on a chart.
This is not the squeeze the Bollinger Bands guide already covers. That post reads one band's own width against its recent history: narrow relative to itself, then trade the expansion. A keltner channel strategy asks a sharper question by comparing two different volatility measures against each other, whether the standard-deviation band has actually tucked entirely inside the average-true-range band. That's a stricter bar than watching one band alone, and it throws fewer false alarms.
What a Keltner Channel Strategy Actually Measures
Chester W. Keltner introduced the idea in 1960, in a book called "How to Make Money in Commodities," under the name "Ten-Day Moving Average Trading Rule." His original version used a simple moving average and the day's high-low range. It worked, in the way most 1960s commodities tools worked: adequately, and only if you already understood what you were looking at.
Linda Bradford Raschke rebuilt it in the 1980s into the version everyone actually trades today. She swapped the simple moving average for an exponential one, so the basis line reacts faster to recent price. Then she swapped the high-low range for Average True Range, the same volatility measure J. Welles Wilder had already built into ADX and the ATR stop-loss math. The modern formula runs a 20-period EMA as the basis, an upper band at the basis plus two times ATR, and a lower band at the basis minus two times ATR.
That last substitution is the whole reason a keltner channel strategy behaves differently from a Bollinger strategy on the same chart. Bollinger Bands widen and narrow based on standard deviation, a measure of how far price has scattered from its own average. Keltner Channels widen and narrow based on ATR, a measure of how far price actually traveled candle to candle, gaps included. Two different definitions of "volatile," measured two different ways, drawn as two different envelopes around price. Most of the time they roughly agree. The interesting trades happen in the gap where they don't.
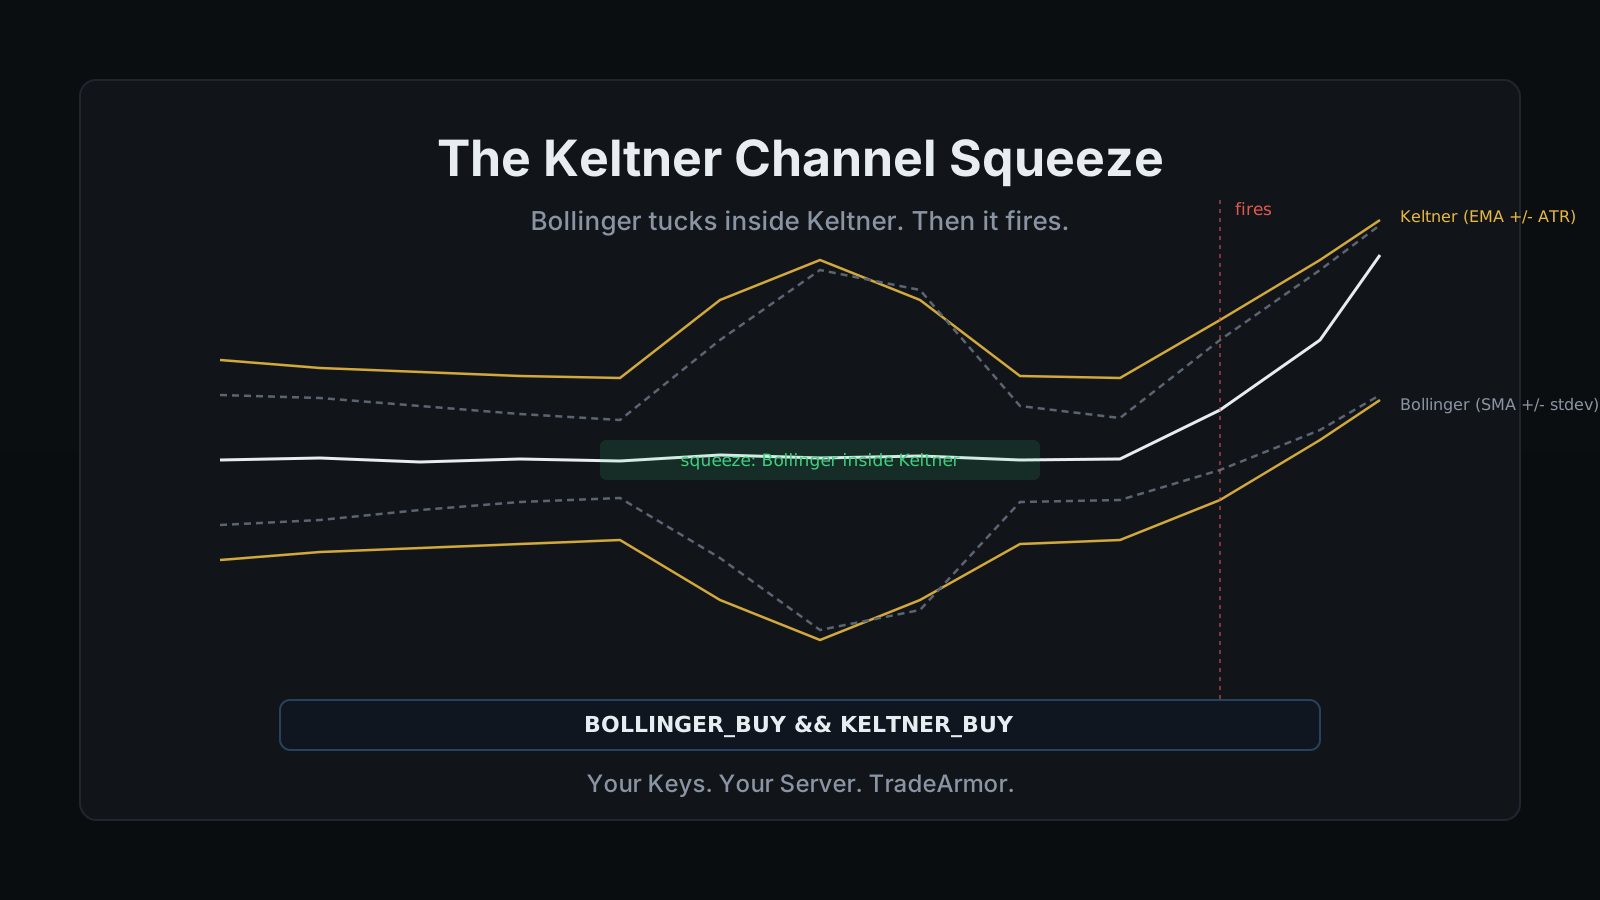
The Squeeze: Bollinger Tucked Inside Keltner
John Carter, running Simpler Trading, built a setup around that gap that traders now call the TTM Squeeze. The idea is almost embarrassingly simple once you see it: when the Bollinger Bands contract so far that they sit entirely inside the Keltner Channel, volatility by the standard-deviation measure has dropped below volatility by the ATR measure. That's a compression tighter than either indicator would flag on its own. Carter's original defaults were the standard 20-period, 2 standard deviation Bollinger Band paired with a 20-period Keltner Channel at 1.5 times ATR, though both sets of settings can be tuned.
Quiet doesn't last on a 24/7 market. It rarely lasts more than a nap's worth of candles before something breaks the coil. When the Bollinger Bands expand back out past the Keltner envelope, the squeeze has fired, and the compression is resolving into an expansion. The whole multi-day setup gets reduced, in most charting tools, to a dot changing from red to green. Nobody who has actually traded the fire remembers it feeling that tidy.
Reading It Without Guessing the Direction
Here's the part that trips people up: the squeeze itself is silent on which way price breaks. It tells you a move is coming, not where. Trading the fire blind, in whichever direction the first candle happens to lean, is how a legitimate volatility read turns into a coin flip with extra steps.
The fix is the same one every compression-based setup needs. Pair the squeeze with something that already answers direction. A Supertrend flip confirming the same side the price broke toward, or momentum already leaning that way on RSI or MACD, turns "a move is starting" into "a move is starting, and here's which way." Trade the squeeze alone and you're betting on a shape. Trade the squeeze with a direction filter and you're betting on a shape that already agrees with the rest of the chart.
Turning the Squeeze Into a Bot Rule
TradeArmor computes both Keltner Channels and Bollinger Bands locally, in real time, as two of the 15 built-in indicators, and each one exposes its own buy and sell boolean state based on where price sits relative to its own bands. A rule like BOLLINGER_BUY && KELTNER_BUY fires only when price breaks the upper edge of both envelopes at once, which filters out the weaker moves where just one band caught the breakout and the other never confirmed it. That's a meaningfully stricter entry than either indicator running alone.
The compression itself, the actual "Bollinger sitting inside Keltner" read that tells you a squeeze is building before it fires, is a visual comparison between two overlaid envelopes on the Charts page rather than a single labeled toggle. Watch the two channels side by side, note when the inner one tucks fully inside the outer one, and gate your entry rule with the confirming indicator once price breaks out. None of it requires writing Python, and every boolean in the formula is something you typed and can re-read later, not a result you're asked to trust on faith.
A squeeze reading is one filter, not the whole system. Keltner, the other 14 built-in indicators, DCA, grid, and futures all run on the same engine. See how the full platform fits together before you trade a compression pattern alone.
Best Keltner Channel Settings for Crypto
Raschke's 20-period EMA with a 2x ATR envelope is the standard starting point, and it's a reasonable one. Carter's TTM version tightens the multiplier to 1.5x ATR specifically to make genuine compressions easier to spot against the wider Bollinger comparison. Neither number was built with a market that trades all day, every day, on a coin that can move five percent before an American trader has finished their coffee.
Shorter-timeframe crypto traders sometimes pull the EMA period down toward 10 to react faster, accepting more noise in exchange for catching the squeeze earlier. Swing traders holding for days tend to leave the defaults alone, since a 20-period EMA on a 4-hour chart already covers more than three days of price action. There's no setting that's correct for every pair on every timeframe. Validate whatever you pick against your own asset with a backtest before it touches real capital, and confirm it again in paper trading before it touches real money.
Where the Squeeze Breaks Down in Crypto
The squeeze setup assumes a market that actually goes quiet before it moves. Crypto's low-liquidity hours, thin order books on smaller pairs, and exchange-specific noise can fake a compression that never resolves into a clean directional move, just a wider chop inside the same range. A squeeze that fires on light volume is a weaker signal than one that fires alongside a real volume surge, the same caveat the Bollinger squeeze carries.
Once a breakout position is open, the squeeze setup hands off to a completely separate discipline: sizing the stop to what the market is actually doing instead of a percentage you picked in advance. That's exactly the job an ATR-scaled stop loss does, and it's worth reading before a squeeze trade goes live, because a correctly identified breakout with a badly sized stop still loses money.
Signals, whether they come from a squeeze read, a Supertrend flip, or anything else in this guide, are algorithmic outputs describing what the market did. They are not investment advice, and past performance on any of them says nothing certain about the next candle.
The Honest Summary
A keltner channel strategy is the sharper half of the squeeze trade: an EMA basis wrapped in an ATR envelope, compared against the Bollinger Bands' own standard-deviation envelope, watching for the moment one tucks inside the other and then breaks back out. The compression doesn't say which way price goes. A direction filter does. TradeArmor runs the Keltner Channel, the Bollinger Bands, the directional confirmation, and the position sizing that follows on one self-hosted engine, on hardware you own, where the exchange API key never leaves your machine. See the plans and get started.
Frequently Asked Questions
What is a Keltner Channel squeeze?
A Keltner Channel squeeze happens when the Bollinger Bands, which measure volatility as standard deviation, contract so far that they sit entirely inside the Keltner Channel, which measures volatility as Average True Range around an EMA. Because the two indicators define quiet differently, one tucking fully inside the other is a stricter compression signal than either band narrowing against its own history alone. When the Bollinger Bands later expand back out past the Keltner envelope, the squeeze has fired and a volatility expansion is underway. The setup, popularized as the TTM Squeeze by John Carter, tells you a move is likely coming. It does not tell you which direction, which is why traders pair it with a separate directional confirmation before entering.
How is a Keltner Channel different from Bollinger Bands?
Both indicators wrap price in an upper and lower envelope around a moving average, but they measure the width of that envelope differently. Bollinger Bands set their width using standard deviation, how far price has scattered from its own recent average. Keltner Channels set their width using Average True Range, how far price has actually traveled candle to candle, including gaps. Bollinger Bands typically use a simple moving average for the middle line, while the modern Keltner Channel, popularized by Linda Bradford Raschke in the 1980s, uses an exponential moving average that reacts faster to recent price. The two rarely disagree by much, but the gap between them, specifically Bollinger tucking inside Keltner, is what defines the squeeze setup.
What are the best Keltner Channel settings for crypto?
The traditional default is a 20-period EMA basis with the bands set at 2 times ATR, which is a solid starting point rather than a fixed rule. John Carter's original TTM Squeeze setup tightens the multiplier to 1.5 times ATR specifically to make the comparison against Bollinger Bands more sensitive. Because crypto trades around the clock and can move sharply outside the hours a traditional market would even be open, some traders shorten the EMA period toward 10 on faster timeframes to catch compressions earlier, accepting more noise in exchange. There is no universally correct setting. Back test whatever multiplier and period you choose against the specific pair and timeframe you trade, then confirm it in paper trading before risking real capital.
Does a Keltner Channel squeeze predict which direction price will break?
No. The squeeze measures compression, a volatility reading, not a directional one. It tells you the market has coiled tighter than usual and that an expansion is statistically likely to follow, but the first candle after the fire can break either way, and trading that candle blind is closer to a coin flip than a strategy. The standard fix is to pair the squeeze with a directional confirmation, such as a Supertrend flip or a momentum reading from RSI or MACD, so the entry only fires when the breakout direction and an independent directional signal agree.
Can a self-hosted crypto trading bot trade a Keltner Channel squeeze automatically?
TradeArmor computes Keltner Channels and Bollinger Bands locally, in real time, as two of its 15 built-in indicators, each exposing its own buy and sell boolean state based on price relative to its bands. A Custom mode rule like BOLLINGER_BUY && KELTNER_BUY combines the two to fire only when both envelopes confirm a breakout at once, filtering out weaker moves where only one band caught it. The compression itself, watching the Bollinger Bands sit inside the Keltner Channel before the fire, is read visually on the Charts page by comparing the two overlaid envelopes. None of it requires writing Python, and every rule is a boolean formula you wrote and can re-read, running on hardware you control with the exchange API key never leaving your machine.