"I don't trust a black box" is a fair thing to say about a lot of crypto trading software, and it's a strange complaint to level at an OBV strategy specifically, since the entire formula fits in two sentences and dates back to 1963. What's actually true is that plenty of platforms gate even the honest, decades-old indicators behind whichever subscription tier costs the most, as if scarcity were the same thing as sophistication. Joseph Granville built the whole premise on one claim: volume precedes price. The question worth asking before you trust that claim on crypto is simpler than the theory. What does "precedes" actually mean when a coin trades on nine exchanges that don't agree on total volume?
I build TradeArmor and trade on it every day, a self-hosted crypto trading bot running on hardware I own instead of somebody else's cloud: a three-year live BTC/USDC signal record, 15 real-time indicators, a plain-English AI strategy builder, and DCA, grid, futures, copy trading, backtesting, paper trading, and tax reporting under one roof. This is a guide to what On-Balance Volume actually measures, where the volume-leads-price claim holds up on crypto and where it quietly breaks, and how to turn the read into a rule your bot executes instead of a line you eyeball on a chart.
What On-Balance Volume Actually Measures
Granville published the idea in a book called "Granville's New Key to Stock Market Profits," and the formula has not changed since. Take a running total, start it anywhere, zero is fine. For every new candle, compare its close to the one before it. Close higher, add that candle's volume to the total. Close lower, subtract it. Close unchanged, leave the total exactly where it sits. No period setting, no smoothing, no lookback window in the base version. Just addition and subtraction, candle by candle, forever.
That simplicity is the whole point. OBV isn't measuring how much a coin traded. It's measuring which side of the trade the volume mostly landed on, cumulated over time. A coin can print the same total daily volume on two different days and produce two completely different OBV moves, because OBV only cares whether that volume showed up on green candles or red ones.
The Core Idea: Confirmation, Not Prediction
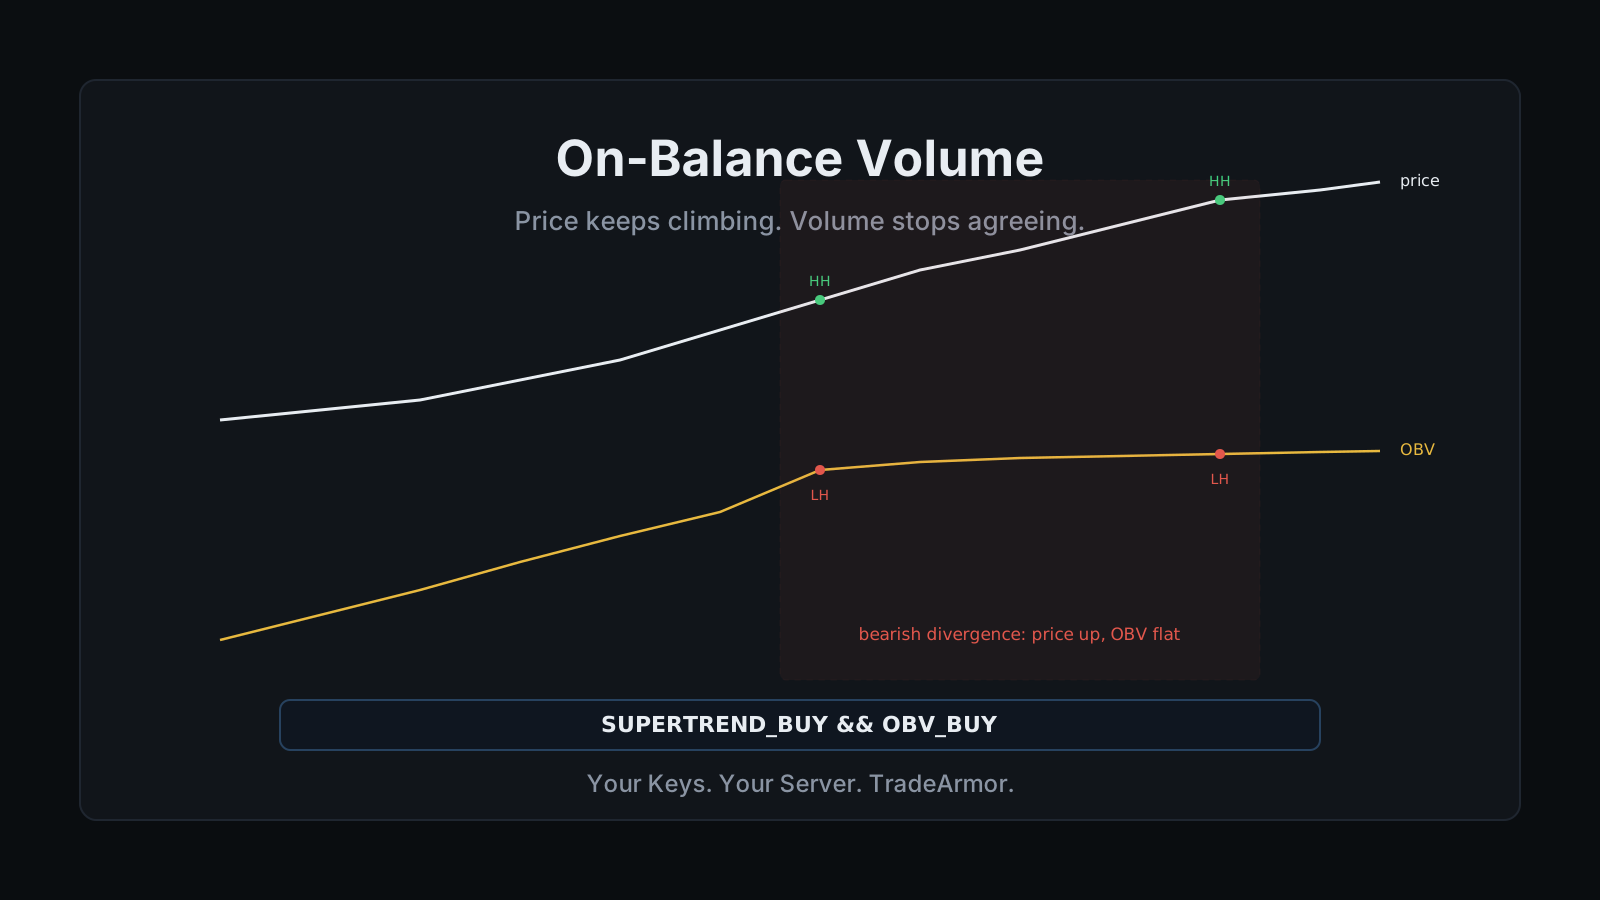
The specific number OBV lands on is meaningless in isolation. Nobody trades "OBV is at 4.2 million." What matters is the shape: is the line rising alongside price, rising faster than price, flat while price climbs, or falling while price climbs. A price uptrend backed by a rising OBV line has real participation behind it, buyers stepping in on the green candles and stepping back on the red ones. A price uptrend where OBV goes sideways is a rally running on thinner and thinner conviction, even if the candlestick chart alone gives no hint of that yet.
That's the entire "volume precedes price" claim in practice. It isn't that OBV predicts the next candle. It's that a change in the underlying volume pattern often shows up in the cumulative line before it shows up as an obvious break in the price trend, which is why traders lean on it as an early-warning confirmation tool rather than a standalone signal.
Reading OBV Divergence
Divergence is where OBV earns its keep. Bearish divergence happens when price prints a higher high but OBV prints a lower high at the same time. Price is still climbing on the chart, but the volume backing each new high is weaker than the volume that backed the last one, a rally running out of buyers even while it's still technically a rally. Bullish divergence is the mirror: price makes a lower low, OBV makes a higher low, and the selloff looks like it's losing the volume it would need to keep breaking down.
Neither pattern is a trade signal by itself. A divergence is a question, not an answer: is this trend actually running out of gas, or is OBV just noisy on this particular pair. The honest use of divergence is as a flag that tightens your other rules, not a standalone entry.
A volume read is one filter, not the whole system. OBV, the other 14 built-in indicators, DCA, grid, and futures all run on the same engine. See how the full platform fits together before you build a strategy around a single line.
Where OBV Breaks Down on a 24/7, Fragmented Market
Granville built OBV for a stock market with one tape and one closing bell. Crypto has neither. The same coin trades on a dozen venues at once, and those venues do not agree with each other on how much volume actually happened. Some exchanges report volume the way a nightclub reports its guest list: impressive, until you ask who's actually inside.
An OBV strategy computed off a single exchange's feed only reads that exchange's participants, which means the same coin can show a clean bullish OBV divergence on one venue and a flat, unremarkable line on another, at the exact same moment. It's a version of the same reset problem the VWAP strategy guide runs into with a market that never closes: an indicator built around one honest tape now has to pick which tape to trust. There's no universal fix. Pick the exchange whose volume you actually believe, and treat the OBV read as a statement about that specific order book, not a verdict on the entire market for that coin.
Turning an OBV Strategy Into a Bot Rule
TradeArmor computes OBV locally, in real time, as one of the 15 built-in indicators, and it exposes its own buy and sell boolean state the same way every other indicator does. A Supertrend entry on its own fires on a trend flip regardless of whether real volume is behind it. A rule like SUPERTREND_BUY && OBV_BUY only fires when the trend flip and rising cumulative volume agree, which filters out the flips that happen on thin, unconvincing participation, the exact setups that tend to fail fastest.
None of that requires writing Python. Every operator in the formula is one you typed and can re-read later, and the AI strategy builder will turn a plain-English description of the same idea into the formula for you if you'd rather describe it in a sentence than write the boolean yourself.
OBV Settings and Practical Notes
OBV has no period to configure in its raw form, which trips people up coming from RSI or MACD where every setting is a number to tune. The line is cumulative from wherever your data starts, full stop. Most charting tools let you lay a moving average, commonly a 20 or 30 period simple or exponential average, over the OBV line itself, which turns the divergence-spotting exercise into something closer to a crossover system: OBV crossing above its own moving average as a confirmation trigger rather than something you eyeball.
Because OBV never resets on its own, two charts starting their data window at different points will show OBV lines that look completely different in absolute terms while agreeing perfectly on shape and direction, which is exactly what the indicator was built to do. Judge the slope. Ignore the number.
The Honest Summary
An OBV strategy is Granville's 1963 bet that volume tells you something price hasn't caught up to yet, made out of nothing more than a running sum of add-or-subtract volume by candle direction. It's cheap to compute, easy to audit, and honest about its own limits once you know crypto splits that volume across venues that don't agree with each other. TradeArmor runs OBV, the other 14 indicators, and the trend filters that pair with them on one self-hosted engine, on hardware you own, where the exchange API key never leaves your machine. Signals, whether from an OBV divergence or anything else in this guide, are algorithmic outputs describing what already happened, not investment advice, and past performance says nothing certain about the next candle. See the plans and get started.
Frequently Asked Questions
What is On-Balance Volume in simple terms?
On-Balance Volume, OBV, is a running cumulative total built entirely from volume and the direction of each candle's close. On an up close, that period's volume gets added to the running total. On a down close, it gets subtracted. On an unchanged close, the total holds. Joseph Granville introduced the idea in his 1963 book Granville's New Key to Stock Market Profits, built on the premise that volume tends to move before price does. The specific number OBV lands on means nothing on its own. Only the shape of the line, rising, falling, or diverging from price, carries the signal.
How do you calculate OBV?
Start OBV at zero, or at any arbitrary baseline, since only the change matters. For each new candle, compare its close to the previous candle's close. If the close is higher, add that candle's volume to the running OBV total. If the close is lower, subtract that candle's volume. If the close is unchanged, OBV stays exactly where it was. Repeat forward through the dataset and the result is a single cumulative line that rises when volume clusters on up candles and falls when it clusters on down candles, with no smoothing or averaging built into the base formula at all.
What is OBV divergence and why does it matter?
Divergence is what happens when price and OBV stop agreeing. Bearish divergence shows up when price prints a higher high but OBV prints a lower high at the same time, which reads as upward momentum losing the volume support that got it there. Bullish divergence is the mirror image: price makes a lower low while OBV makes a higher low, suggesting the selling is not backed by the volume a genuine breakdown would need. Neither divergence is a trade signal by itself. Both are a reason to look closer at whether a trend has the participation to continue.
Does OBV work well on crypto exchanges?
It works, with a caveat that does not exist in equities: crypto trades continuously across a dozen venues that never fully agree on volume, and some of those venues have a long, well-documented history of reporting inflated numbers. An OBV strategy computed off a single exchange's feed only reads that exchange's participants, not the market as a whole, and a coin that looks like it is building strong OBV confirmation on one venue can look completely different on another. The fix is not complicated. Trade OBV on the exchange whose volume you actually trust, and treat the read as evidence about that order book specifically, not a verdict on the entire market.
How do you turn an OBV strategy into a crypto trading bot rule?
TradeArmor computes OBV locally in real time as one of its 15 built-in indicators and exposes it as a buy or sell boolean state you combine with any other indicator using logical operators. A rule like SUPERTREND_BUY && OBV_BUY only fires when a trend-following entry and rising cumulative volume agree, filtering out the trend signals that fire on thin participation. None of it requires writing Python, and the plain-English AI strategy builder turns a sentence describing the idea into the formula if you would rather not write the operators yourself. Signals are algorithmic outputs, not investment advice, so backtest and paper trade any rule before real capital touches it.