VWAP tells an institutional trader one thing: did today's fills beat the volume weighted average, or lag it. That is the whole point of the indicator, and it is the starting point for any VWAP strategy. Import it into a market that runs 24 hours a day, seven days a week, and the tool gets fuzzy fast, because VWAP was built around a bell that crypto never rings.
I build and trade with TradeArmor, a self-hosted crypto trading bot that runs on hardware you own, with built-in BTC/USDC signals carrying a three-year track record, 15 real-time indicators, a plain-English AI strategy builder, and DCA, grid, futures, copy trading, backtesting, paper trading, and tax reporting on one engine. VWAP is one of those 15 indicators, sitting in the volume family alongside OBV. This is a guide to what a VWAP strategy for crypto actually measures, the session problem crypto creates that stocks never had, and how to turn the reading into a rule a bot follows.
Most people asking about this want two things that rarely come from the same tool. They do not want to write Python to express an idea. And they want to see exactly which rule the bot is following, not just trust that it worked. A VWAP strategy earns both, once you understand the one assumption the indicator quietly makes and crypto quietly breaks.
What VWAP Actually Measures
Volume weighted average price is a running average of price, weighted by how much volume traded at each price. Multiply each period's typical price by its volume, sum that running total, and divide by the running total volume. A large print at $65,000 pulls VWAP toward $65,000 harder than a thin print at the same level. Price does not just move, it moves with size behind it, and VWAP is the common indicator that tracks both at once.
Institutional desks use it as a scorecard. A large buy order filled below VWAP beat the average; filled above it, the desk paid up. Retail traders borrowed the same line for a simpler job: price above VWAP tends to read bullish for the session, price below it tends to read bearish, and a return to VWAP after a stretch away from it is a common mean reversion setup.
Why Crypto Breaks the Session Assumption
Every one of those readings assumes a session with a start and an end. The stock market opens at 9:30 and closes at 4:00, so VWAP resets every morning and means something specific by the closing bell. Crypto trades every hour of every day, with no open and no close, so the reset has to be invented rather than observed.
Two conventions cover most of what you will see. A rolling VWAP recalculates over a fixed trailing window, commonly 24 hours, and never resets at all. A fixed daily VWAP resets at a chosen clock time, usually 00:00 UTC, and behaves closest to the stock market original. Neither is more correct than the other. What actually matters is knowing which one your chart, your data feed, and your bot are using, because two VWAP lines computed on the same candles with different resets will disagree, sometimes by a meaningful margin, and a trader who does not know that will read the divergence as a signal instead of a settings mismatch.
Anchored VWAP: Starting the Clock Where It Matters
Session VWAP answers what the average has been today. Anchored VWAP answers a sharper question: what has the average been since the moment that mattered. You pick a starting candle, an all time high, a violent dump, a listing, a macro headline, and VWAP cumulates forward from that single point instead of from midnight.
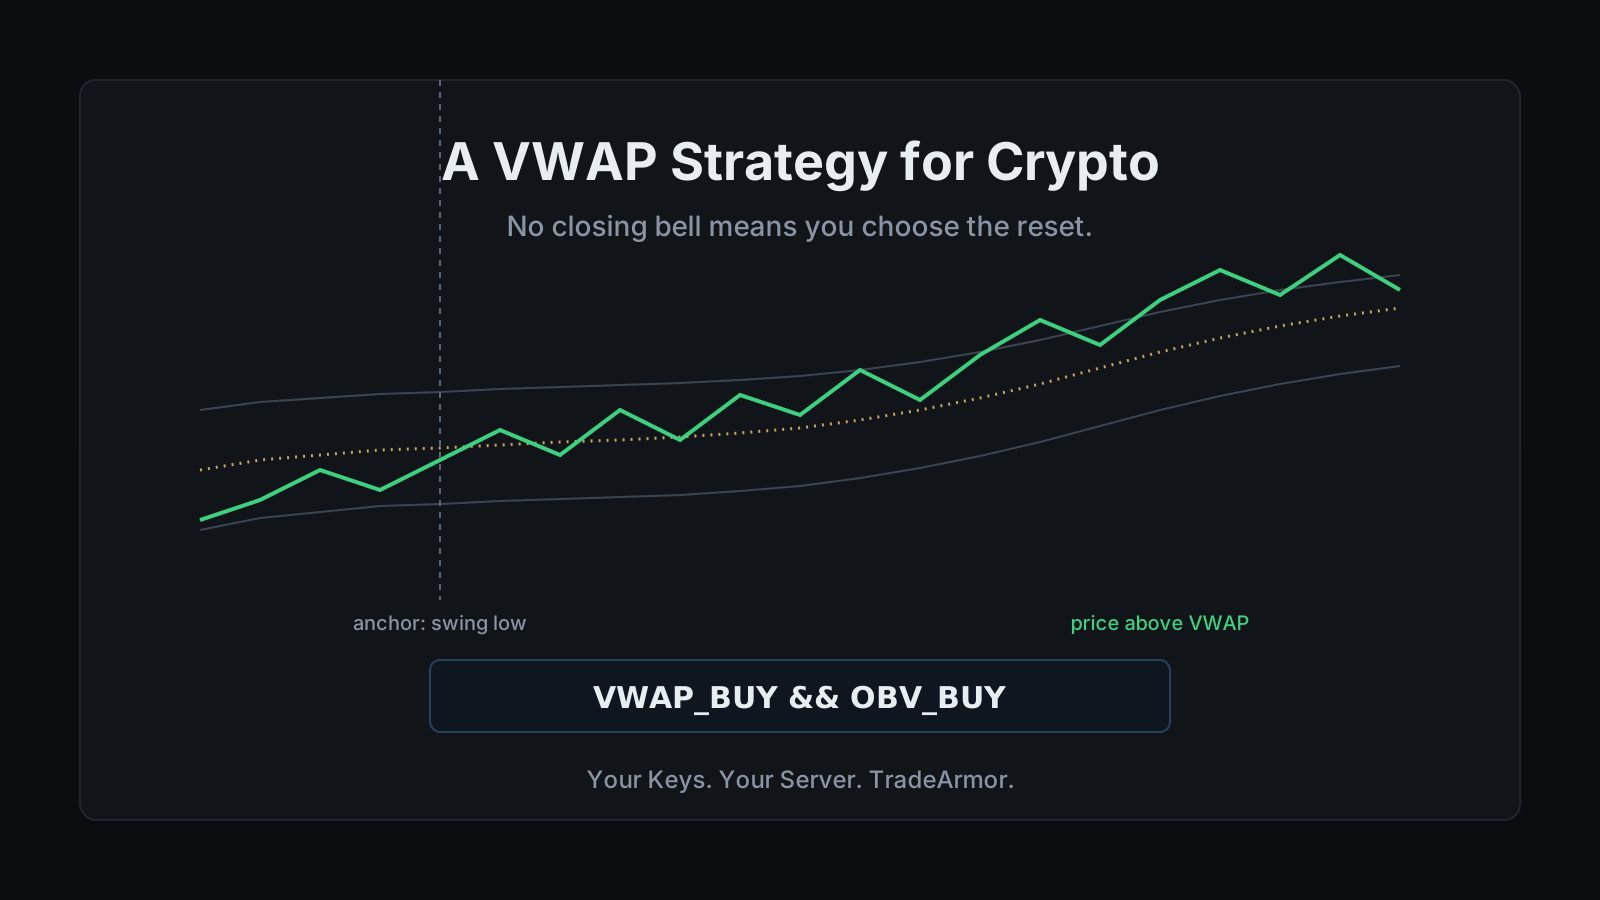
The read is different in kind, not just in setting. A coin trading back above its anchored VWAP from a crash low tells you the average buyer since that low is now in profit, which is a meaningfully different fact than "price is above today's session average." Traders anchor to the last major swing high or low and watch whether a retest holds the anchored line as support, or slices through it, before trusting a continuation.
VWAP Bands: The Mean Reversion Trade
Plenty of traders wrap standard deviation bands around VWAP the same way they would around a moving average. The first band, one standard deviation out, contains roughly two thirds of price action around the average. The second band, two standard deviations out, contains most of the rest. A tag of the outer band reads as statistically stretched relative to the session, and that stretch is the setup a mean reversion trader is looking for.
TradeArmor does not compute a separate VWAP band token, so if you want that exact deviation-band read on a bot rule, you already have it: Bollinger Bands measure the same two-standard-deviation stretch, just anchored to a moving average instead of a volume-weighted one. Pairing VWAP_BUY with BOLLINGER_BUY gets you a close approximation of a VWAP band tag without inventing a formula token that does not exist. The Bollinger Bands strategy guide covers the mechanics of that band in full.
One indicator is not a strategy, and a strategy is not the whole bot. VWAP, the other 14 indicators, built-in signals, DCA, grid, and futures all run on the same engine. See how the full platform fits together before you bet an account on a single line on a chart.
What Volume Profile Adds, and Why It Is Not a Bot Rule
VWAP and Volume Profile get confused constantly because they both start from volume, and they measure close to opposite things. VWAP is one line, cumulative, weighted by time. Volume Profile is a horizontal histogram, plotted by price rather than time, showing how much volume traded at each price level regardless of when. The point of control is the single price with the most volume. The value area is the price band holding most of the session's volume around it. Traders use those levels the way a chartist uses support and resistance, as places price tends to react.
TradeArmor's 15 indicators do not include Volume Profile. It is not a running calculation the way RSI or VWAP is; it is a distribution you read visually off a completed range, and there is no honest boolean state to expose as a Volume Profile buy signal. If the value area matters to your read, the closer bot-native approximation is pairing VWAP with OBV, TradeArmor's other volume indicator, which tracks whether volume is accumulating on up candles or down candles over time rather than by price level. It answers a related question with numbers a formula can actually use, instead of a chart you eyeball.
Turning a VWAP Strategy Into a Bot Rule
TradeArmor computes all 15 indicators locally in real time and exposes each as a buy or sell state you combine with logical operators: && for and, || for or, ! for not, parentheses for grouping. A bare VWAP entry is one line:
VWAP_BUY
VWAP_BUY fires on a bullish price-to-VWAP relationship. Used alone, it fires on every crossing, which in a choppy range means it fires constantly and means very little. Gate it with a second read:
VWAP_BUY && OBV_BUY
Now the rule only triggers when price sits favorably against the volume-weighted average and cumulative volume is actually confirming the move, which strips out a chunk of the noise a bare crossing generates. If you would rather describe the idea than write the operators, the plain-English AI strategy builder turns "buy when price is above VWAP and volume is confirming" into the formula for you. It is bring-your-own-key, so you plug in your own AI provider and the subscription carries no markup for it. The AI writes the rule. You still read it before it trades.
Where a VWAP Strategy Fits in the Bigger System
VWAP tells you where price sits relative to the volume-weighted average. It says nothing about position size, when to take profit, or what happens if the trade goes the wrong way, and those decisions are what actually determine the outcome. Run VWAP as a gate on a proven entry rather than the whole system, the same way you would run Supertrend or an EMA crossover: let the primary signal propose the trade, require the volume read to agree, then hand the position to sizing and exit logic that does not care which indicator triggered the entry. The DCA engine and its buy gates are where that discipline actually gets enforced.
Nothing about a VWAP reading changes who holds your exchange API key. On a self-hosted bot the key sits in a local config on your own hardware, carrying trade permission only, never withdrawal. The indicator can be right or wrong about the market. Custody does not get a vote either way.
The Honest Summary
A VWAP strategy for crypto has to solve a problem the stock market never handed it: there is no closing bell to reset the average, so the reset itself, rolling or fixed, is a decision you make rather than one the market makes for you. Anchor to the moment that matters when you want a sharper read than the session default, pair the deviation-band idea with Bollinger Bands since VWAP does not ship its own, and treat Volume Profile as a chart you read rather than a formula you write. Gate the entry, write it as a boolean rule you can actually check, and let position sizing and exits do the rest of the job. TradeArmor is the self-hosted platform I built to run all of that on hardware you own, where your keys never leave your machine and one subscription replaces the stack of a chart tool, a signal service, and a SaaS bot. See the plans and get started.
Frequently Asked Questions
What is a VWAP strategy in simple terms?
VWAP, volume weighted average price, is a running average of price that is weighted by how much volume traded at each level, not just where price sat. A big print at a given price pulls the average toward it harder than a thin print at the same level, so VWAP tracks price and size at once instead of price alone. Traders read price above VWAP as a bullish read for the session and price below it as bearish, and a stretch away from VWAP followed by a return to it is a common mean reversion setup. A VWAP strategy is simply a rule built around that relationship, usually gated with a second indicator so a single crossing does not fire the trade on its own.
Does VWAP work on crypto, since it trades 24/7?
It works, but the indicator was designed around a stock market session that opens and closes on a schedule, and crypto has neither. There is no bell to reset the average, so the reset itself becomes a choice rather than a market fact. Two conventions cover most tools: a rolling VWAP that recalculates over a trailing window, commonly 24 hours, and never resets, or a fixed daily VWAP that resets at a chosen clock time, usually 00:00 UTC. Neither is more correct than the other, but two charts computing VWAP with different resets on the same candles will disagree, sometimes by a meaningful margin, and mistaking that disagreement for a signal is the most common way people misread this indicator on crypto.
What is anchored VWAP and how is it different from session VWAP?
Session VWAP answers what the average has been over a fixed window, whether that window is a rolling 24 hours or a fixed daily reset. Anchored VWAP answers a sharper question: what has the average been since a specific moment that mattered, an all time high, a violent dump, a listing, a macro headline. You pick the starting candle and the calculation cumulates forward from that single point instead of from a generic clock time. A coin trading back above its anchored VWAP from a crash low tells you the average buyer since that low is now in profit, which is a meaningfully different fact than price simply sitting above today's session average.
What is the difference between VWAP and Volume Profile?
They both start from volume and measure close to opposite things. VWAP is a single line, cumulative over time, weighted by volume as it happens. Volume Profile is a horizontal histogram plotted by price rather than time, showing how much total volume traded at each price level regardless of when the trades occurred. The point of control is the single price with the most volume, and the value area is the band holding most of the session's volume around it. Traders use those levels the way a chartist uses support and resistance. TradeArmor's 15 indicators include VWAP but not Volume Profile, since Volume Profile is a distribution read off a completed range rather than a running calculation with an honest buy or sell state to expose.
How do you turn a VWAP strategy into a crypto trading bot rule?
TradeArmor computes all 15 indicators locally in real time and exposes each as a buy or sell state you combine with logical operators, so VWAP_BUY on its own fires on every bullish price to VWAP crossing, which in a choppy range means it fires constantly and means very little. Gating it with a second read, for example VWAP_BUY && OBV_BUY, only triggers when price sits favorably against the volume weighted average and cumulative volume is actually confirming the move. You never have to write Python to express it, and if you would rather describe the idea in a sentence than write the operators, the plain-English AI strategy builder turns it into the formula for you. Signals are algorithmic outputs, not investment advice, so backtest and paper trade any rule before it touches real capital.