Your backtest looks incredible. Five indicators all agree, the equity curve climbs in a straight diagonal line, and the win rate reads like a typo. Then you go live, and the same five-indicator rule chops sideways for a month before giving back half the gain. Nothing in the formula changed. What changed is that the market stopped behaving like the eleven months of data you tuned the rule against. "I need something between plug-and-play and write-your-own" is usually what led you to stack indicators in the first place: one canned signal felt too simple, five felt like control. Somewhere between those two numbers is a rule that actually holds up, and you don't find it by adding a sixth indicator. You find it by figuring out which of the five are pulling their own weight and which are just repeating what the first one already said.
I run this argument through TradeArmor daily, a self-hosted crypto trading platform built around a boolean formula engine that computes RSI, MACD, Stochastic, Supertrend, ADX, Bollinger Bands, ATR, Keltner Channels, VWAP, OBV, EMA, and SMA locally in real time, on top of built-in BTC/USDC signals with a multi-year live track record, a plain-English AI strategy builder, and DCA, grid, futures, copy trading, backtesting, paper trading, and tax reporting, all running on hardware I own. "Show me the rules it's following, not just the result" is close to the whole design philosophy: every indicator exposes a plain BUY or SELL state, so a five-indicator strategy is a line of boolean logic you can read line by line, not a black box you have to take on faith. That transparency is exactly what makes the signal stacking question answerable instead of a guess.
Confluence Is Not the Same Thing as Agreement
Confluence is a real, useful idea. It means combining independent reasons to take a trade, so that if one read is wrong the others still hold. The failure most traders actually commit is not confluence. It's agreement, and the two look identical on a chart until you check where each indicator's number comes from.
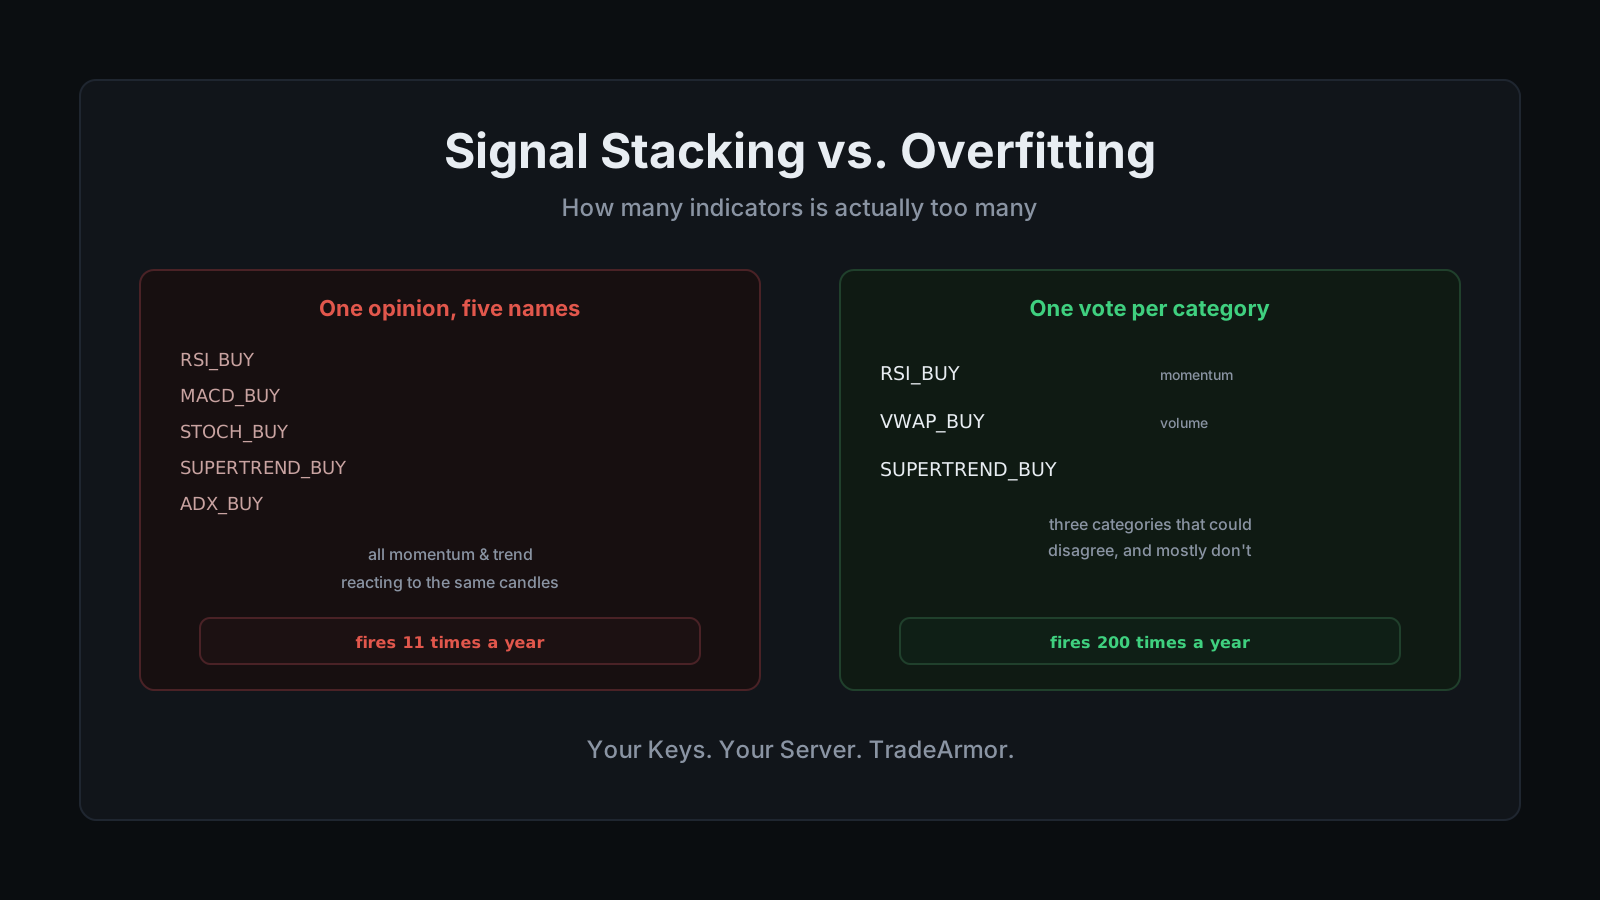
RSI, MACD, and Stochastic all derive from the same recent closing prices over similar lookback windows. When price grinds higher for a week, all three tend to say the same thing at roughly the same time, because they are all doing versions of the same math on the same candles. Stack three of them into one rule and you have not built three independent votes. You have built one opinion, counted three times, wearing three different names. A backtest cannot tell the difference between real confluence and an echo chamber, and it will happily reward the redundancy, because redundant conditions that agree on the training data will, by definition, agree on the training data. Every SaaS bot's landing page still lists "five indicators combined" as a headline feature, and not one of them mentions that four of the five just nodded along with whatever the first one said.
Signal Stacking and the Category Trap: Five Indicators, One Opinion
TradeArmor's indicators split into four real categories, and the split is not cosmetic, it is the fix. Momentum and trend: RSI, MACD, Stochastic, Supertrend, ADX. Volatility and bands: Bollinger Bands, ATR, Keltner Channels. Volume: VWAP, OBV. Moving averages: EMA, SMA.
A rule that pulls two or three conditions from inside a single category is signal stacking in the bad sense: more code, same information. A rule that pulls one condition from two or three different categories is closer to actual confluence, because a momentum read, a volatility read, and a volume read are measuring genuinely different things about the same candle. They can disagree. When independent signals that could disagree instead line up, that agreement means something. When five variations on the same math line up, it doesn't.
RSI_BUY && MACD_BUY && STOCH_BUY
That rule looks like triple confirmation. It is closer to a single momentum read asked three times in a row.
RSI_BUY && VWAP_BUY && SUPERTREND_BUY
That rule pulls momentum, volume, and trend, three categories that can genuinely contradict each other. When they don't, the agreement carries real weight.
See how the boolean formula engine, the fifteen indicators, and the rest of the platform fit together. See all features.
Overfitting: When the Backtest Is Lying to You
Curve fitting is the technical name for a rule tuned until it flatters one specific stretch of history. Every free parameter you add, every extra indicator, every threshold you nudge from 30 to 32 because it bumped the win rate, gives the optimizer one more knob to twist until the historical curve looks perfect. QuantifiedStrategies.com's breakdown of curve fitting puts it plainly: a strategy with two or three rules and one or two parameters is far harder to overfit than one with ten, because there are simply fewer ways for the optimizer to accidentally memorize noise instead of learning a pattern.
The math behind this isn't superstition. It's degrees of freedom, and a 2026 academic paper on reducing overfitting in data-driven trading strategies makes the same point in more formal terms: more tunable parameters create more opportunities to fit random noise rather than a repeatable edge, and the gap between backtested and live performance tends to widen as that parameter count climbs. Five indicators, each with its own threshold, is a lot of knobs. The backtest that resulted from tuning all of them isn't a preview of what your bot will do next month. It's a photograph of what would have worked, exactly once, on data that already happened, and photographs of the past make lousy weather forecasts.
AND, OR, and the Trade You Don't Notice You're Making
TradeArmor's formula engine gives you both operators, and the choice between them is where most overstacked rules quietly go wrong. Every && you add makes the rule more selective. Fewer candles satisfy all the conditions at once, which sounds like extra safety until you realize it also means fewer real trades backing whatever edge your backtest claims to have found.
A five-condition AND rule that fired eleven times over a year is not five times more confident than a two-condition rule that fired two hundred times. It's the opposite. Eleven data points is barely enough to say anything at all, and a curve built on eleven trades is exactly the kind of thin evidence that curve fitting loves to dress up as extra confirmation. ||, meanwhile, loosens the rule until almost any single indicator can trigger it alone, which solves the sample-size problem and reintroduces the redundancy problem from the other direction. Neither operator is the villain. Reaching for more of either one without checking what it does to your sample size is, and no vendor's marketing copy is going to warn you about it, because "more selective" sounds like a feature right up until it means eleven trades a year.
How Many Is Actually Too Many
For most retail strategies, two to three conditions is the practical ceiling, pulled from different categories, not the same one. That isn't an arbitrary round number. It's roughly the point where you've captured momentum, volatility or trend strength, and maybe volume, without turning the rule into a search for eleven perfect candles in a year of data.
If you want a fourth condition, the better move is usually to replace one of the first three rather than add to them. Swapping RSI_BUY for ADX_BUY inside a rule that already has a momentum read from MACD changes what the rule is testing. Adding ADX_BUY on top of both just makes the rule pickier without making it smarter.
Test whatever you land on the honest way. Our guide to backtesting a crypto strategy walks through running the same rule against historical data before it touches a live account, and the discipline that actually catches curve fitting is holding back a slice of that data the rule never sees during design, then checking performance on the untouched slice. If the rule falls apart the moment it meets data it wasn't tuned against, the backtest told you a story about the past, not about the future. Paper trading on live market data is the next honest checkpoint, because it removes the temptation to keep re-tuning against a fixed historical window.
Building the Rule Without Guessing
If reading and writing && chains isn't how you want to spend an evening, describe the strategy in plain English and TradeArmor's AI strategy builder converts it to the same boolean syntax the engine runs, flagging a condition that will never trigger or one that quietly duplicates a signal you already have. It's a translation and validation layer, bring your own key, no markup on the subscription for using it. It does not pick your indicators for you, and it will not tell you whether a rule is overfit just because it's syntactically valid. That judgment call, how many conditions, from how many categories, tested on how much untouched data, still belongs to the person running the bot.
Individual pages on RSI plus MACD, Supertrend, Bollinger Bands, and how the whole engine evaluates a rule candle by candle go deeper on each piece. This post is about the part nobody's marketing page covers: what happens when you own all of them and have to decide how many to run at once.
Signal stacking earns its keep when the indicators you combine can genuinely disagree and mostly don't. It turns into overfitting the moment you're stacking indicators that were never going to disagree in the first place, dressed up as extra confirmation a thinner, more honest rule already had. TradeArmor is the self-hosted platform I run these rules on, on my own hardware, where the formula stays readable and the keys never leave the machine. See the plans and get started.