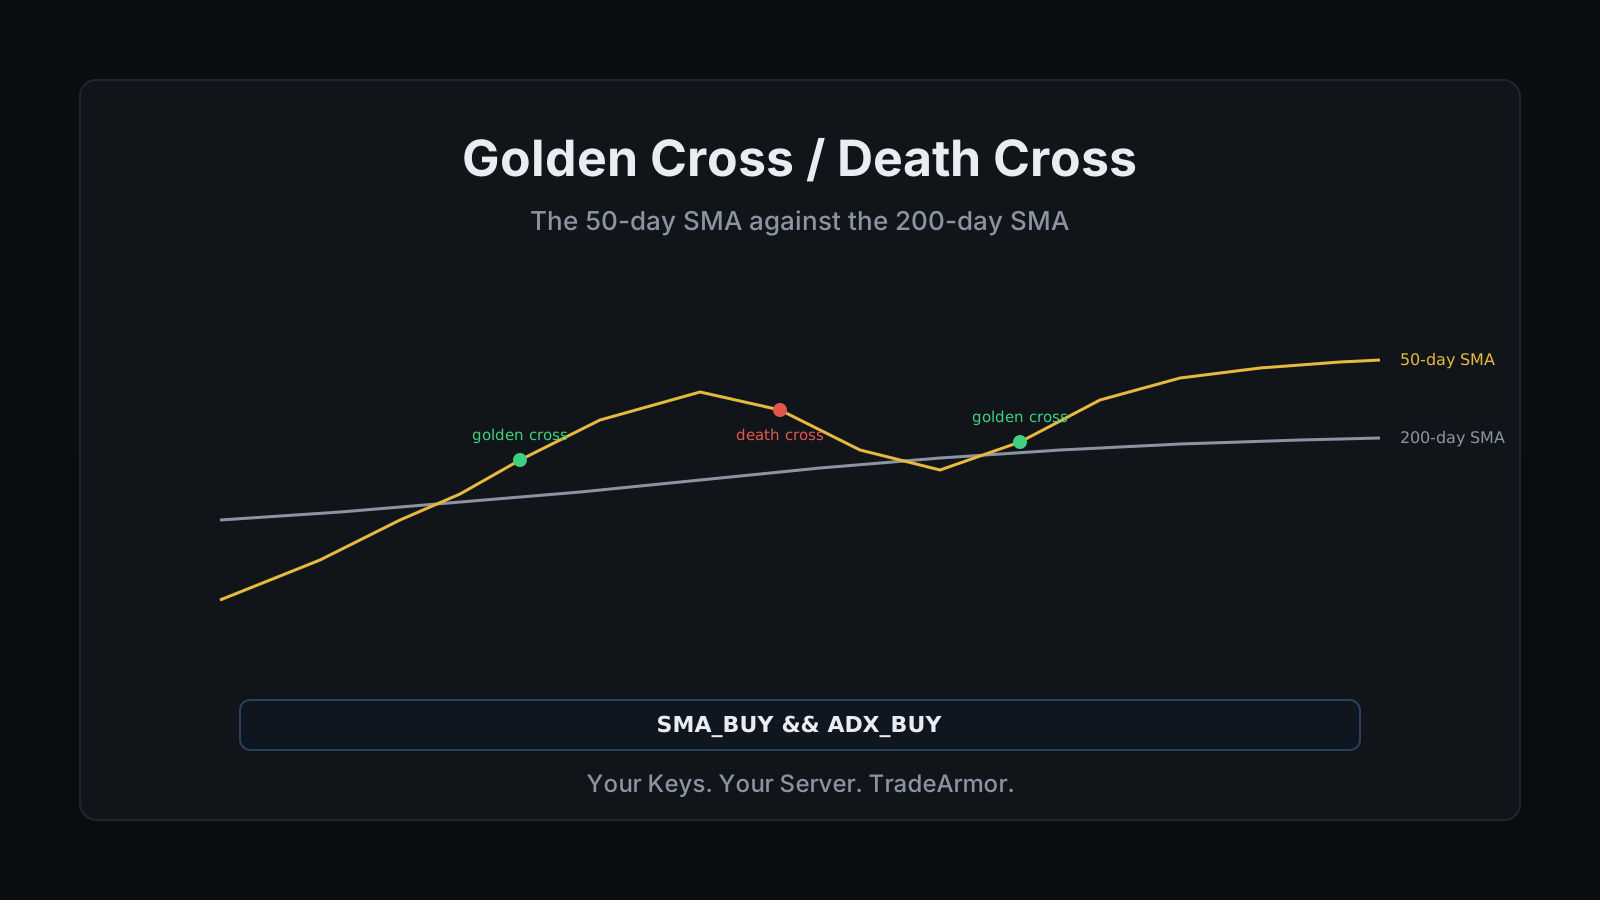
Every time Bitcoin's 50-day average climbs back above its 200-day average, the same chart makes the rounds with the same headline: golden cross. The golden cross and death cross, its bearish mirror image, are two of the oldest signals in technical analysis, and traders who have watched a few cycles know the pattern is real. They also know the chart never explains what actually crossed, why it took two full moving averages to notice, or what happens to your position if you buy the headline three days after the cross instead of the candle it printed on. And nobody wants to be the person refreshing a chart every morning hoping to catch the exact candle before the rest of the internet does.
I trade with TradeArmor, a self-hosted crypto trading platform that runs on hardware I own: built-in BTC/USDC spot signals with a multi-year track record, 15 real-time technical indicators, a plain-English AI strategy builder, and DCA, grid, futures, copy trading, backtesting, paper trading, and tax reporting on one engine. This is a guide to the golden cross and death cross as they were originally defined, on the simple moving average, not the faster exponential version, and how to turn the signal into a rule your bot checks on every candle instead of a headline you react to a few days late.
What the Golden Cross and Death Cross Actually Are
A golden cross is a shorter simple moving average crossing above a longer one. A death cross is the same event running in reverse, the shorter average crossing below the longer one. The pair almost everyone means by these terms, unless they say otherwise, is the 50-day SMA against the 200-day SMA on the daily chart.
The SMA itself is the plainest calculation in technical analysis: add up the closing prices over the window, divide by the number of candles. No weighting, no smoothing beyond the average itself. When the 50-day number climbs above the 200-day number, it means the recent ten weeks of price have, on average, moved higher than the trailing ten months. That is the entire signal. It is a statement about where two averages currently sit relative to each other, nothing more exotic than that.
Why the Classic Definition Runs on SMA, Not EMA
Our EMA crossover strategy guide covers the faster, exponential version of this same idea, and it is worth being precise about which one you are actually trading, because they behave differently. An EMA weights recent candles more heavily, so it reacts to a shift in price sooner. An SMA weights every candle in its window the same, whether it printed yesterday or 199 days ago, so it only moves once enough of the window's older, stale data ages out and gets replaced.
That equal weighting is why the SMA version is the one that became the household term. It turns later, which sounds like a disadvantage until you remember what the signal is being used for. Nobody trades the golden cross for a fast scalp entry, which is good, because by the time it fires the fast scalp already happened to somebody else, weeks ago, without you. It is a regime filter, a slow, deliberately unhurried read on whether the broader trend has actually flipped, and the SMA's stubbornness is a feature when that is the job.
The 50/200 Pair, and Why It Stuck
Fifty and two hundred days map to roughly ten weeks and ten months, a short-term and long-term read that predates crypto by decades in equities. Shorter SMA pairs exist. Some crypto-specific guides run a 10 and 50-day cross for a faster read. But if a chart account posts "golden cross" with no other context, it means 50 over 200, full stop. That shared vocabulary is the whole reason the term crossed over from stock charts to Bitcoin threads in the first place: everyone already agreed on what it meant before crypto needed a word for it.
TradeArmor computes both the SMA and EMA versions locally as two of its 15 real-time indicators, so you are never stuck with just one read of a crossover. See the full indicator list and everything else the platform runs on your own hardware.
What the Cross Has Actually Meant for Bitcoin
Bitcoin has printed several macro golden crosses on the daily 50/200 SMA across its history, and CoinDesk covered the most recent one forming in May 2026 as traders watched the averages converge. Several of the earlier crossings were followed by extended rallies, which is exactly why the signal draws attention every single time it reappears.
Here is the part the parabola screenshots leave out. A moving average crossover is arithmetic on prices that already happened. It cannot see the future any better than you can. What it does is confirm, days or weeks after the fact, that a shift has been building long enough to drag a 200-day average with it. Past performance is not indicative of future results, and the same setup has produced flat or losing stretches in other assets and other periods. Investopedia's breakdown of the golden cross makes the same point about equities: it is a lagging, confirming signal, not a forecast, and treating it as one is how a real trend read turns into a chase.
The Lag Problem Is the Whole Point
A crossover that took two hundred days of price to trigger is never going to catch you the bottom or the top. That is not a flaw to be engineered around. It is the trade-off you are choosing when you pick this signal over a faster one. The SMA version accepts a later entry in exchange for far fewer false starts than a twitchy short-period indicator throws off in a choppy market.
The failure mode is different from a typical whipsaw. Because the cross is rare, the temptation is to treat every occurrence as a major event and pile in without checking whether the market actually has the strength to follow through. A 50/200 cross with weak momentum behind it is still just two averages meeting. Confirming it with a separate trend-strength read, the same way a Supertrend filter earns its keep on faster signals, is what turns a headline into a rule you can trust.
Writing It as a Bot Rule
TradeArmor computes SMA locally as one of its 15 built-in indicators and exposes it as a buy or sell boolean state, so the golden cross entry reads as one line instead of a chart you have to eyeball every morning:
SMA_BUY
SMA_BUY is true while the fast SMA sits above the slow SMA, flipping on at the golden cross and off at the death cross. Run bare, it fires rarely but blindly, buying into a cross even when the trend behind it is weak. Gate it with a trend-strength read and the rule only acts when the market is actually backing the move:
SMA_BUY && ADX_BUY
That pairs the golden cross with ADX, which measures directional strength rather than direction itself, so the combined rule only fires when both the crossover and the trend's conviction agree. You can read the exact two conditions the bot checked on the candle it acted, instead of taking a fill on faith. If writing the operators is not how you want to spend an evening, the plain-English AI strategy builder turns a sentence describing this idea into the formula for you, bring-your-own-key, no markup on top of the subscription.
One Slow Signal Inside a Faster Operation
A golden cross tells you almost nothing about position size, exit timing, or where your keys are sitting while all of this executes. Those questions matter more than the entry, and they are the ones a chart screenshot never answers. A chart account has never once told anyone where their exchange API permissions were set. The DCA engine handles how a position gets built once the cross confirms, the exit rules handle when it closes, and our free DCA backtester is where you can see how an entry like this would have behaved against real historical candles before committing anything. None of it requires writing Python, and the full mechanics of how a bot checks conditions candle by candle instead of waiting for you to notice a headline live in our guide to how crypto trading bots work.
The golden cross and death cross earned their reputation honestly: a slow, equal-weighted signal that survives noise better than almost anything faster, at the cost of confirming a trend well after it started. Trade the SMA version for what it actually is, a regime filter rather than a timing tool, gate it with something that measures conviction, and let a bot check it on every candle instead of a headline that shows up a few days after the fact. TradeArmor is the self-hosted platform I built to run rules like this on my own hardware, where the keys never leave the machine and one subscription replaces the stack of a chart tool, a signal service, and a SaaS bot. See the plans and get started.