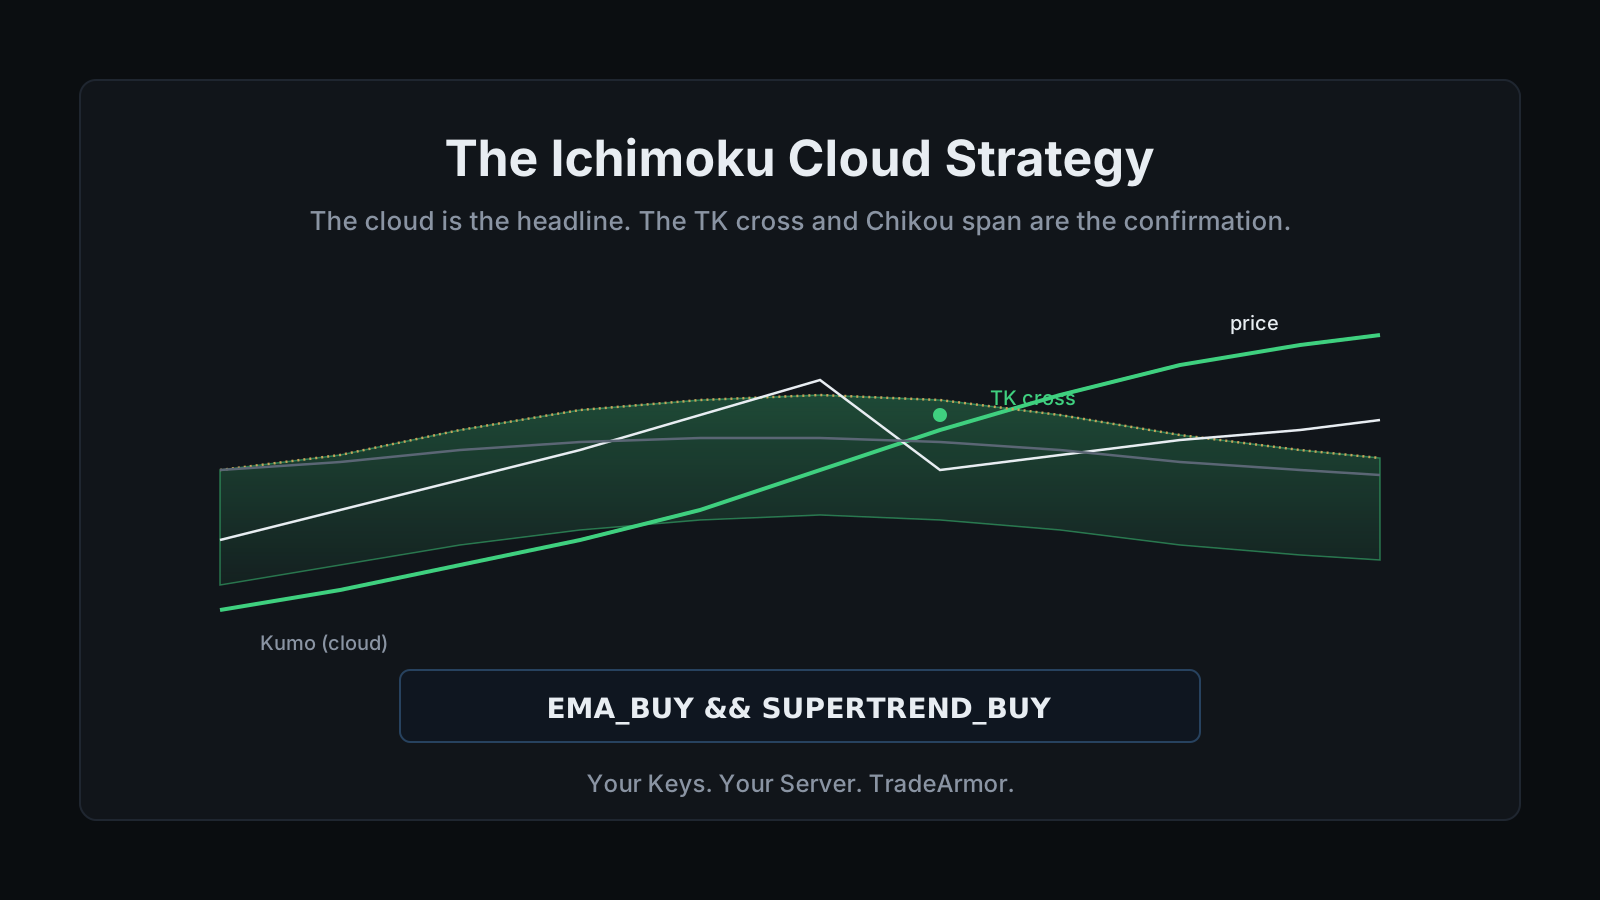
A green cloud looks like a green light for an Ichimoku cloud strategy. Price closes above the Kumo, the shading flips from red to green on the chart, and at a glance it reads as a clean buy. So a trader buys, at the exact moment the cloud is thickest and still acting as a wall the price has to fight through. Two days later the position is flat, chopping under a rising Kijun line, and the trader decides Ichimoku is broken. Ichimoku did exactly what it was built to do. The trader read one line out of five and skipped the two that would have told them to wait.
That gap, between the part of Ichimoku everyone notices and the parts that actually confirm a trade, is where most Ichimoku strategies quietly cost real money. I build and trade with TradeArmor, a self-hosted crypto trading bot that runs on hardware you own, with built-in BTC/USDC signals carrying a three-year track record, 15 real-time indicators, a plain-English AI strategy builder, and DCA, grid, futures, copy trading, backtesting, paper trading, and tax reporting on one engine. This is a guide to what the Ichimoku Cloud is actually measuring, the settings crypto traders argue about, where the system breaks, and the honest way to wire an Ichimoku read into a bot that runs without you.
I'm writing the mechanics because Ichimoku has a reputation it partly earned. Five lines and a shaded region look like a lot of homework, so most explainers either flatten it to "buy above the cloud, sell below it" or bury you in Japanese terminology and walk away. Neither one leaves you with a strategy, and neither one gets you what most people actually want out of an indicator like this: something between plug-and-play and write-your-own, where the rules it's following are visible instead of just the result. Strip the jargon and what's left is one of the more disciplined trend systems available, mostly because it refuses to let you enter on the first green candle you see.
What the Ichimoku Cloud Actually Measures
Goichi Hosoda spent roughly three decades developing Ichimoku Kinko Hyo before publishing it in 1969, and the five components map to two jobs: trend direction and confirmation.
The Tenkan-sen, or conversion line, is the midpoint of the highest high and lowest low over nine periods. It moves fast, closer in behavior to a short moving average than most people expect. The Kijun-sen, or base line, is the same midpoint calculation over 26 periods, and it moves slower on purpose, acting as the trend's baseline. The Senkou Span A is the midpoint of the Tenkan and Kijun, projected 26 periods into the future. The Senkou Span B is the 52-period high-low midpoint, also projected 26 periods forward. The shaded area between Span A and Span B is the Kumo, the cloud, and because both spans are plotted ahead of price, the cloud gives you a forward-looking support and resistance zone that most indicators simply cannot draw. The fifth line, the Chikou Span, is today's close plotted 26 periods in the past, sitting there purely to confirm whether the current move actually has room against where price traded a month ago.
Most technical indicators are content with one line and a threshold. Ichimoku ships five lines and an entire shaded weather system, then asks you to read all of them before it lets you in. It is less an indicator than an audit.
Reading the Signal: Kumo, the TK Cross, and Chikou Confirmation
Cloud thickness tells you how hard the wall is, not just where it sits. A thin cloud is a weak zone that price can punch through on a single strong candle. A thick cloud, the kind formed when Span A and Span B are stretched far apart, is a heavier wall that usually needs real conviction to clear. Because both spans are projected forward, you can see next week's support and resistance zone today, including the moment where Span A crosses Span B inside the projection, called a cloud twist, which flags a probable shift in trend before price ever gets there.
The Tenkan-sen crossing above the Kijun-sen is the TK cross, and it behaves like a moving average crossover with a shorter memory, reacting to momentum shifts faster than the cloud itself does. On its own the TK cross is noisy. Paired with price closing above the cloud, it starts to mean something. Paired with the Chikou Span sitting clear above the price it is measured against from 26 periods back, confirming that the current close genuinely outpaces where the market was a month ago, you have the three-part setup Ichimoku was actually designed to produce: price above the cloud, a bullish TK cross, and Chikou clear of price. That is the high-conviction read. The cold open at the top of this piece skipped two of those three and paid for it.
Best Ichimoku Settings for Crypto: 9/26/52 or Something Else
The default 9/26/52 is not an arbitrary triple. Hosoda built it around a Japanese trading week that ran six days: nine represents a week and a half, 26 is one month of business days, 52 is two months. Crypto trades all seven days, all day, forever, so a fair argument exists for scaling those numbers up. Traders who make the switch commonly land on 20/60/120, roughly doubling the defaults to account for the missing weekend gaps, or split the difference at 10/30/60.
The counter-argument is that 9/26/52 is the default on nearly every charting platform, watched by the largest share of Ichimoku traders on earth, which makes those exact levels somewhat self-fulfilling whether or not the underlying math fits a 24/7 market. Neither camp is obviously wrong, which means the settings are a question for data, not preference. There's a free DCA backtester you can run in the browser to get a feel for how a single parameter change moves an equity curve before you touch anything indicator-specific. Timeframe matters as much as the period settings: the daily and four-hour charts filter out most of the false cloud tests that flood a 15-minute chart with signals that never had a chance.
A five-line indicator is still just one input. Ichimoku, the other 14 indicators, built-in signals, DCA, grid, and futures all run on the same engine. See how the full platform fits together before you size a position off one system alone.
Where Ichimoku Breaks: the Lag Is the Whole Design
The Kijun-sen and both cloud spans are lagging and projected values, and the Chikou Span exists specifically to look backward before it confirms anything forward. That structure is not a flaw. It is the entire filter, and it is why Ichimoku ignores a lot of the noise a faster tool would react to. The cost is timing. A confirmed Ichimoku entry rarely catches the exact bottom or top of a move, and in a genuine trend that late entry is a small, known price for skipping the false starts.
The same lag turns brutal in a range-bound market. Price tests the cloud, gets rejected, comes back and tests it again, and every failed test looks identical to the setup that eventually works, right up until it does. Ichimoku is a trend tool first and a chop tool never, and no amount of settings tweaking changes that fact. What does help is treating the far edge of the cloud as a defined stop level: place it just past the boundary you'd need price to reclaim for the trade thesis to still be true, so a failed test costs you a known amount instead of an opinion about when to give up.
Running an Ichimoku Cloud Strategy on a Self-Hosted Bot
Here's the honest part most product pages skip. TradeArmor computes RSI, MACD, Stochastic, Supertrend, Bollinger Bands, EMA, and the rest of its 15 built-in indicators locally in real time, and the full five-line Ichimoku system is not one of them today. I'd rather say that plainly than let a headline imply otherwise.
Two paths exist right now, and both are real. TradingView already computes Ichimoku natively, so you can build the exact three-part confirmation, price above cloud, bullish TK cross, Chikou clear, as a TradingView alert and fire it at your bot's webhook signal endpoint. From there it runs through the identical execution engine as a built-in cava-signal: same DCA gating, same position sizing, same exit rules, same local key custody. The chart lives on TradingView. The money and the keys stay on your machine.
If you'd rather stay entirely inside the dashboard with no outside chart to babysit, you can approximate the same trend-plus-confirmation logic with indicators the engine already runs. An EMA crossover gives you the fast-line-over-slow-line trend read the Tenkan and Kijun relationship provides. Supertrend gives you a trailing reference similar in spirit to trading off the cloud's edge. Gated together as a formula:
EMA_BUY && SUPERTREND_BUY
That is not literally Ichimoku, and I won't pretend it is. It answers the same two questions Ichimoku answers, trend direction and momentum confirmation, using two indicators the engine already computes with zero chart outside the dashboard. If neither the webhook route nor hand-writing a formula sounds appealing, the plain-English AI strategy builder turns a sentence like "buy when the trend indicator and the momentum indicator both agree" into the formula for you, and because it's bring-your-own-key, you supply your own AI provider and TradeArmor adds no markup on top.
The Part No Indicator Handles
Ichimoku, or its EMA-plus-Supertrend stand-in, answers when to enter and roughly where to invalidate the trade. It says nothing about how much to buy, whether to scale in with DCA legs instead of a single entry, or when to take profit on the way up, and those decisions do more to the final account balance than any indicator ever will. Entry logic gets the guide. Sizing and exits quietly decide the result.
None of it matters either way if the exchange API key behind the strategy sits on someone else's server. A self-hosted bot runs the identical Ichimoku, EMA, or Supertrend logic whether the key lives in a vendor's cloud or in a local config file on your own hardware. Only one of those setups keeps a bot restricted to trade permission, never withdrawal, entirely outside your control.
The Honest Summary
Ichimoku is a trend-and-confirmation system, not a single green light. Read the cloud for the wall it represents, require the TK cross and Chikou Span before you trust a breakout, pick a settings scheme and back it with data instead of a preference, and place your stop past the cloud's far edge so a failed test has a known cost. Whether you run it through a TradingView webhook or approximate it with EMA and Supertrend inside the dashboard, run it on a platform that also handles sizing, exits, and where your keys actually live. That's what TradeArmor is: one self-hosted subscription instead of a chart tool, a signal service, and a SaaS bot stacked on top of each other, with your API keys never leaving your machine. See the plans and get started.
Frequently Asked Questions
What is the Ichimoku Cloud in simple terms?
Ichimoku Kinko Hyo, usually shortened to the Ichimoku Cloud, is a trend system built from five lines instead of one. Two of those lines, the Tenkan-sen and the Kijun-sen, are fast and slow midpoint averages that behave like a moving average crossover. Two more, the Senkou Span A and Senkou Span B, are projected 26 periods into the future and shaded between them to form the Kumo, or cloud, which acts as dynamic support and resistance. The fifth line, the Chikou Span, is the current close plotted 26 periods in the past, and it exists purely to confirm that a move has real follow-through. Read together, the five lines answer three questions at once: is price above or below the cloud, has momentum actually turned, and does the recent close confirm it. Read separately, any one of them gives a false sense of certainty.
What are the best Ichimoku settings for crypto?
The default is 9, 26, and 52, and those numbers were never arbitrary. Goichi Hosoda built them around a six-day Japanese trading week, where nine represents a week and a half, 26 is one month, and 52 is two months. Crypto trades every day of the year, so a real argument exists for scaling the settings up, and traders who make that adjustment commonly land on 20, 60, 120, roughly doubling the defaults, or a middle-ground 10, 30, 60. The counter-argument is that 9/26/52 is what every charting platform ships as the default and what the overwhelming majority of Ichimoku traders still watch, which makes those specific levels somewhat self-fulfilling regardless of the math behind them. Neither side is obviously right. Backtest both on the pair and timeframe you actually trade before you pick one, and treat the daily and four-hour charts as more reliable than anything under an hour, since lower timeframes generate the most false cloud tests.
What is a Kumo breakout, and what actually confirms it?
A Kumo breakout is price closing outside the cloud after trading inside or below it, and on its own it is the weakest form of an Ichimoku signal, which is exactly what trips up most new users. A high-conviction bullish breakout requires three things to line up at once: price closes above the cloud, the Tenkan-sen crosses above the Kijun-sen, and the Chikou Span sits above the price it is being compared to from 26 periods back. Any one of those alone is a maybe. All three together is the setup Ichimoku was actually built to produce, and skipping the confirmation lines to trade the cloud color by itself is the single most common way traders lose with this indicator.
Why does an Ichimoku strategy feel like it signals late?
Because it is built to. The Kijun-sen and the cloud edges are lagging and projected values by design, and the Chikou Span exists specifically to look backward before it confirms anything forward. That structure is what filters out the noise a faster indicator would react to, but it also means an Ichimoku entry rarely catches the exact bottom or top. In a real trend that lag costs you a small, known slice of the move in exchange for fewer false starts. In a range-bound market the same lag means you get pulled into a cloud test right as it fails, which is why Ichimoku is a trend tool first and a chop tool never. Placing a stop just past the far edge of the cloud gives you a defined invalidation level either way.
Can a self-hosted crypto trading bot trade an Ichimoku strategy automatically?
Not as a single native indicator today. TradeArmor computes RSI, MACD, Supertrend, Bollinger Bands, EMA, and the rest of its 15 built-in indicators locally in real time, but the full five-line Ichimoku system is not one of them yet. Two honest paths exist right now. Build the exact three-part Ichimoku confirmation as a TradingView alert, since TradingView already computes Ichimoku natively, and fire that alert at your bot's webhook endpoint, where it runs through the same execution engine, DCA gating, and exit rules as any built-in signal. Or approximate the same trend-plus-confirmation read using indicators the engine already runs locally, such as an EMA crossover gated with Supertrend, which is not literally Ichimoku but answers the same two questions with a boolean formula and no external chart required.