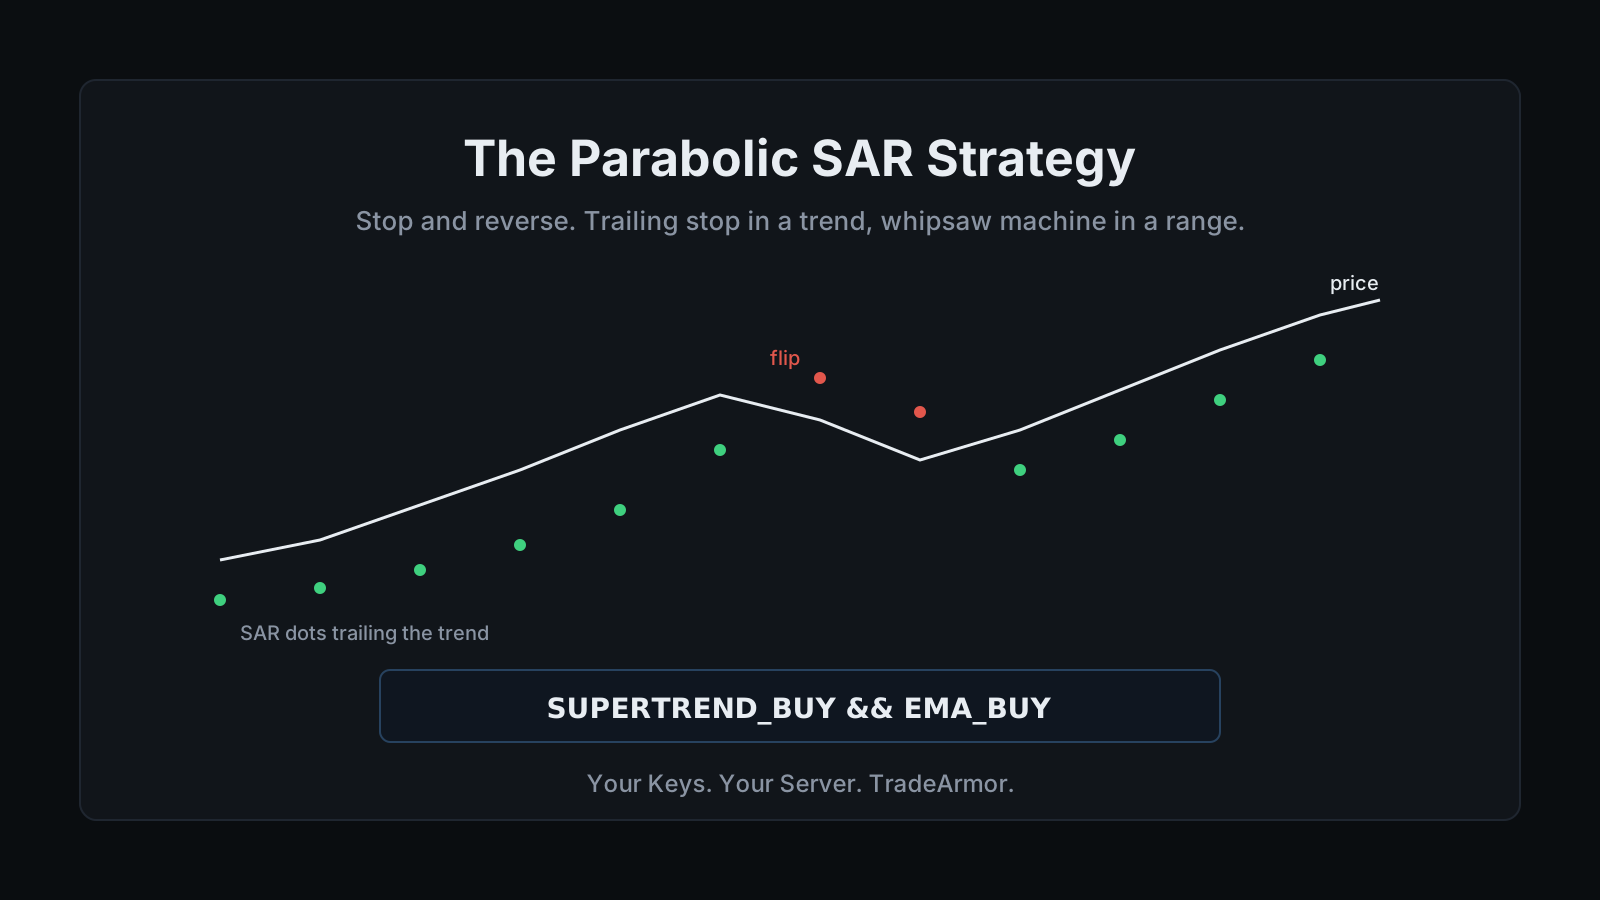
Set Parabolic SAR on a four-hour Bitcoin chart during a dead-flat range and watch what happens. The dots flip from below price to above it, then back below, nine or ten times in a session, each flip closing one position and opening the opposite one a little worse off than the last. That is not a bug. It is the indicator doing exactly what J. Welles Wilder Jr. designed it to do: stop, and reverse. A parabolic sar strategy that skips the one question the indicator never asks, is the market actually trending, turns a trailing stop into a fee generator.
I build and trade with TradeArmor, a self-hosted crypto trading bot that runs on hardware you own, with built-in BTC/USDC signals carrying a three-year track record, 15 real-time technical indicators, a plain-English AI strategy builder, and DCA, grid, futures, copy trading, backtesting, paper trading, and tax reporting on one engine. This is a guide to what Parabolic SAR actually calculates, the acceleration factor almost nobody adjusts, why it shreds capital in a range, and the honest way to run a SAR-style trailing exit on a bot that trades without you watching a single dot.
Most traders come to SAR wanting something between plug-and-play and hand-rolled Python, a rule they can see and verify instead of an output they just have to trust. That instinct is correct. The execution of it is usually wrong, because SAR alone answers only half the question it's supposed to answer.
What a Parabolic SAR Strategy Is Actually Calculating
Wilder introduced Parabolic SAR in his 1978 book "New Concepts in Technical Trading Systems," the same book that gave the world RSI and ATR. SAR stands for stop and reverse, and the name is not marketing copy. Each dot is simultaneously a trailing stop for the current position and the exact price that flips you into the opposite position if price trades through it.
The formula for an uptrend is straightforward once you see the pieces: tomorrow's SAR equals today's SAR plus the acceleration factor times the gap between the extreme point and today's SAR. A downtrend mirrors it, subtracting instead of adding. The extreme point, EP, is the highest high reached during the current uptrend, or the lowest low during a downtrend. It updates every time price makes a new extreme, and it never moves back in the trend's disfavor.
The acceleration factor, AF, is the part most traders never look at twice. It starts at 0.02. Every time a new extreme point prints, AF steps up by another 0.02, capped at 0.20. That step is why the dots crawl slowly at the start of a trend and then race to catch price the longer the trend runs. Wilder built SAR to get impatient the older a trend gets, which is a polite way of saying it wants to lock in the run before the run forgets it was ever a run.
Parabolic SAR Settings for Crypto: Why the Defaults Fight You
0.02 and 0.20 were tuned on commodities markets trading five days a week in the 1970s. Bitcoin trades 24 hours a day, 365 days a year, at a volatility profile commodities traders of that era never had to price. Run the defaults on BTC and the SAR frequently accelerates too fast, tightening the stop into a normal pullback and flipping you out of a trend that was never actually over.
The fix most crypto traders land on is slowing the whole system down: a starting AF of 0.01 or 0.02 with a lower cap around 0.10 to 0.15 instead of 0.20. That gives price more room to breathe before the dot catches up, at the cost of giving back a slightly larger slice of profit on the way out. Nobody agrees on the exact right number, and anyone who claims they do hasn't backtested it on the pair and timeframe they actually trade. There's a free DCA backtester you can run in the browser to see how a single parameter shift moves an equity curve before you touch anything indicator-specific.
One indicator is still just one input. Parabolic SAR, the other 14 built-in indicators, cava-signals, DCA, grid, and futures all run on the same engine. See how the full platform fits together before you size a position off one system alone.
Where a Parabolic SAR Strategy Breaks: the Whipsaw
SAR has one blind spot, and it's the same blind spot every trailing-stop-that-also-flips indicator has: it cannot tell the difference between a real trend and a range about to chop it to pieces. In a strong trend the dots trail nicely behind price and rarely get touched until the move genuinely ends. In a range, price crosses back and forth across the dot every few candles, and every crossing is a full reversal, not a small loss. You get stopped out long, immediately flipped short, stopped out of that too, and flipped long again a few candles later, which is a fun way to discover that "stop and reverse" can mean the market fires you and rehires you twice before lunch.
The standard fix is a trend filter that only lets SAR trade when a trend is actually confirmed. ADX above 25 is the one traders reach for most often, because ADX measures trend strength without caring about direction, which is exactly the gap SAR leaves open. One widely cited SAR-plus-ADX backtest on EUR/USD daily bars found the win rate climb from 47 percent to 58 percent once trades below ADX 25 were filtered out, while total trade count dropped by roughly 40 percent. Crypto's volatility is nothing like EUR/USD's, so treat that as evidence the filter works in principle, not a number to expect on BTC. Backtest your own pair before you trust it.
Running a SAR-Style Trailing Exit on a Self-Hosted Bot
Here's the honest part most guides skip. TradeArmor computes RSI, MACD, Stochastic, Supertrend, Bollinger Bands, EMA, and the rest of its 15 built-in indicators locally in real time, and Parabolic SAR is not one of them today. I'd rather say that plainly than let a headline imply otherwise.
Two paths work right now, and neither one requires trusting a black box. Supertrend is the closest built-in relative SAR has: it's also an ATR-based trailing stop that flips sides on a confirmed break, the same stop-and-reverse job SAR does, just anchored to volatility instead of a fixed acceleration curve. Pairing Supertrend with the engine's native trailing take-profit sell rule builds a system that trails behind a live position and locks in gains the way a well-tuned SAR would, without importing SAR's whipsaw problem in a range. Gated with a trend filter of its own:
SUPERTREND_BUY && EMA_BUY
If your TradingView chart already has SAR tuned the way you like it, wire the exact signal, an SAR flip confirmed above an ADX threshold, as a TradingView webhook alert into the bot. It runs through the identical execution engine, same DCA gating, same exit rules, same local key custody, as any built-in signal. The chart stays on TradingView. The keys and the money stay on your machine. If neither route sounds appealing, the plain-English AI strategy builder turns a sentence like "trail my stop behind the trend and only take reversals when the trend is strong" into the formula for you, and because it's bring-your-own-key, you supply the AI provider and pay TradeArmor nothing extra for it.
Sizing and Exits Still Do the Heavy Lifting
An exit rule, SAR or its Supertrend stand-in, tells you when to leave a trade. It says nothing about how much you put into the trade in the first place, whether you scaled in with DCA legs instead of one entry, or how the position behaves during a drawdown the indicator never saw coming. Entry and exit logic get all the attention in guides like this one. Position sizing quietly decides whether a good exit rule actually saves the account or just delays the damage.
None of that changes what should happen to the exchange API key running any of it. A parabolic sar strategy, a Supertrend stand-in, or a hand-tuned webhook rule all execute the same way whether the key sits in a vendor's cloud or a local config file on hardware you control. Only one of those arrangements keeps the bot restricted to trade permission, never withdrawal, entirely outside anyone else's reach.
The Honest Summary
Parabolic SAR is a trailing stop and a reversal trigger fused into one line of dots, tuned by an acceleration factor that speeds up the longer a trend runs. It works well in a trend and badly in a range, and the real fix is a trend filter, not a better guess at the acceleration setting. Run it through a TradingView webhook if you already trust your SAR settings, or lean on the built-in Supertrend-plus-trailing-take-profit combination that does the same stop-and-reverse job without the default whipsaw problem, on a platform that also handles sizing, exits, and where your keys actually live. That's TradeArmor: one self-hosted subscription instead of a chart tool, a signal service, and a SaaS bot stacked on top of each other, with your API keys never leaving your machine. See the plans and get started.
Frequently Asked Questions
What does Parabolic SAR actually stand for and calculate?
SAR stands for stop and reverse, and the name describes exactly what each dot does. J. Welles Wilder Jr., the same analyst behind RSI and ATR, introduced it in his 1978 book New Concepts in Technical Trading Systems. Every dot is simultaneously a trailing stop for the position you're in and the exact price that flips you into the opposite position if price trades through it. The formula for an uptrend is tomorrow's SAR equals today's SAR plus the acceleration factor times the gap between the extreme point and today's SAR, and a downtrend mirrors it by subtracting instead of adding. The extreme point is the highest high reached during the current uptrend, or the lowest low during a downtrend, and it only ever moves in the trend's favor. The acceleration factor is what makes the dots crawl slowly early in a trend and then race to catch price the longer that trend runs.
What are the best Parabolic SAR settings for crypto?
The default starts the acceleration factor at 0.02, steps it up by 0.02 every time a new extreme point prints, and caps it at 0.20. Those numbers were tuned on commodities markets trading five days a week in the 1970s, not on an asset that trades 24 hours a day at crypto's volatility. Run the defaults on Bitcoin and the SAR often accelerates too fast, tightening the stop into a normal pullback and flipping you out of a trend that was never actually over. Most crypto traders who adjust it land on a slower system: a starting factor around 0.01 to 0.02 with the cap lowered to somewhere between 0.10 and 0.15, which gives price more room before the dot catches up, at the cost of giving back a slightly larger slice of profit on the way out. Nobody agrees on one universal number, and the only honest answer is to backtest the setting on the specific pair and timeframe you actually trade before trusting it with real size.
Why does a parabolic sar strategy whipsaw so much in a ranging market?
SAR has one blind spot: it cannot tell the difference between a real trend and a range that's about to chop it to pieces. In a strong trend the dots trail behind price and rarely get touched until the move genuinely ends. In a range, price crosses back and forth over the dot every few candles, and every crossing triggers a full reversal, not a small loss, so you get stopped out long, flipped short, stopped out of that, and flipped long again, paying the spread each time. The standard fix is a trend filter that only lets SAR trade once a trend is confirmed, and ADX above 25 is the one traders reach for most, because ADX measures trend strength without caring about direction. One widely cited SAR-plus-ADX backtest on EUR/USD daily bars found the win rate climb from 47 percent to 58 percent once trades below ADX 25 were filtered out, while the total number of trades dropped by roughly 40 percent. Crypto's volatility profile is nothing like EUR/USD's, so treat that as evidence the filter works in principle, not a number to expect on Bitcoin, and backtest your own pair before trusting it.
Is Parabolic SAR a good entry signal, or is it really just an exit tool?
It's honestly stronger as an exit and a trailing stop than as a standalone entry trigger, even though the stop-and-reverse design tempts people into using it for both. Every SAR flip is a valid trailing-stop exit for the trend you're already in. Not every SAR flip is a good reason to enter a brand new position in the opposite direction, because a flip during chop is just as likely to be the start of the next whipsaw as the start of a real trend. The stronger use of the indicator is to let a separate trend or momentum read decide when to enter, and let SAR, or an ADX-confirmed version of it, manage the trailing exit once you're in. That division of labor is what most of the ADX-filter research is actually validating: SAR does its best work when something else has already confirmed the trend is real.
Can a self-hosted crypto trading bot trade a parabolic sar strategy automatically?
Not as a native indicator today. TradeArmor computes RSI, MACD, Stochastic, Supertrend, Bollinger Bands, EMA, and the rest of its 15 built-in indicators locally in real time, and Parabolic SAR is not one of them yet. Two honest paths exist right now. Supertrend is the closest built-in relative SAR has, since it's also an ATR-based trailing stop that flips sides on a confirmed break, and pairing it with the engine's native trailing take-profit sell rule reproduces the same stop-and-reverse job without importing SAR's default whipsaw problem in a range. Or, if your TradingView chart already has SAR tuned the way you like it, wire the exact signal as a webhook alert into the bot, where it runs through the identical execution engine, DCA gating, and exit rules as any built-in signal, with your keys staying local the entire time.