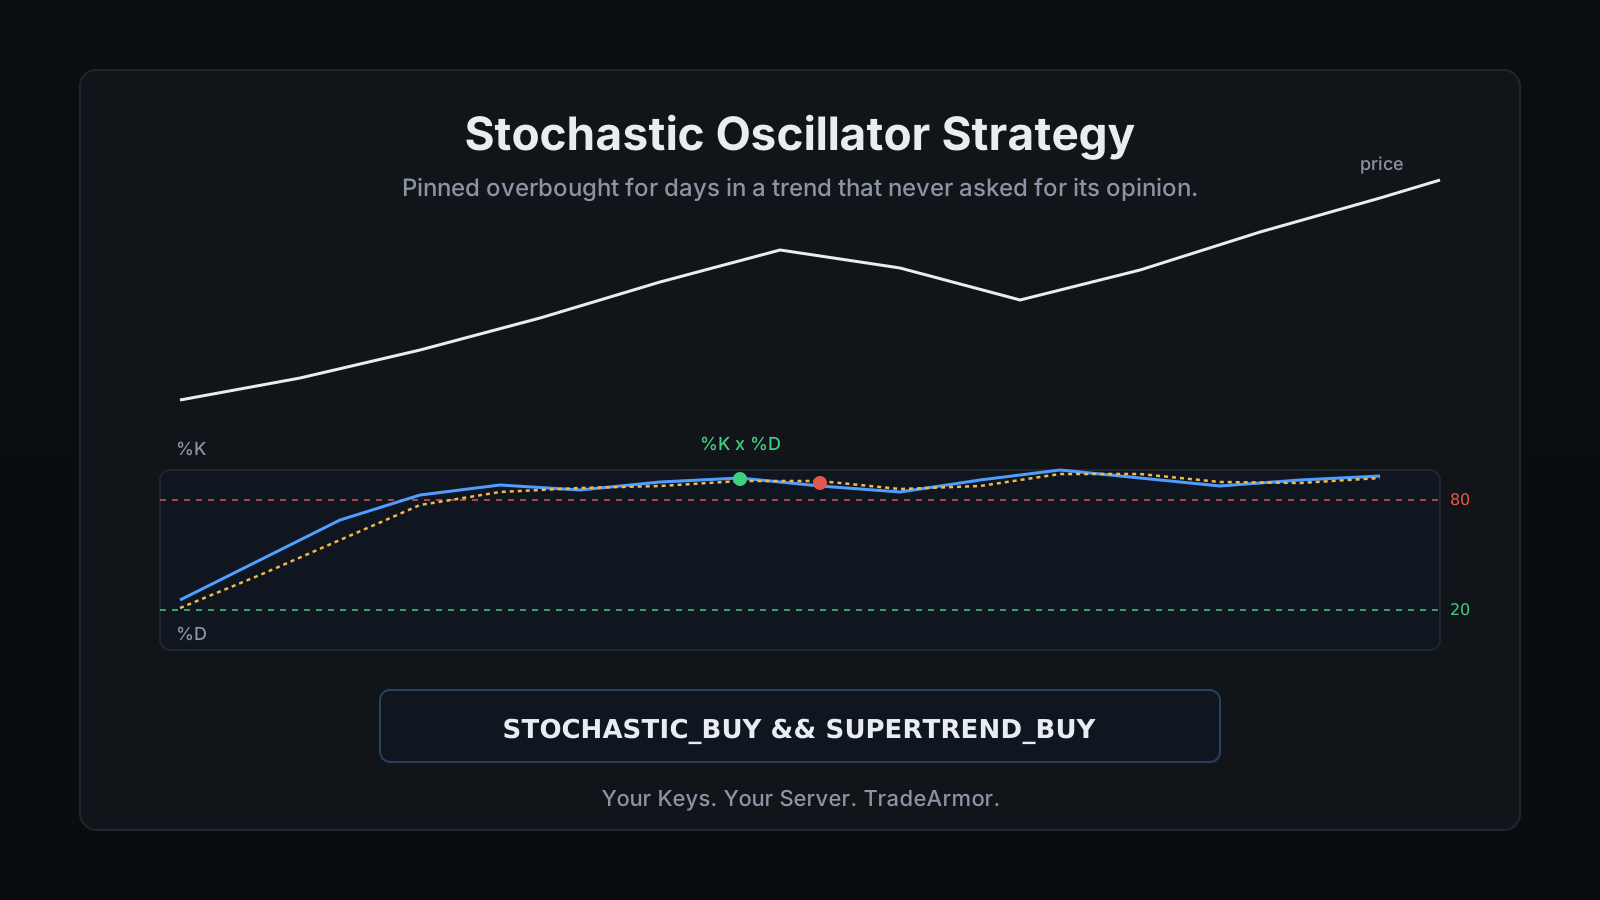
Why does a stochastic oscillator strategy flash overbought during the best five days of a bull run? Because %K and %D were never built to measure trend. They measure where the most recent close sits inside a fixed lookback window, and a strong trend keeps sliding that window out from under the reading. Price pins near the top of its own recent range for days while it keeps climbing, and a trader who reads that pin as "sell now" exits a winner two weeks early.
I build and trade with TradeArmor, a self-hosted crypto trading bot that runs on hardware you own, with built-in BTC/USDC signals carrying a three-year track record, 15 real-time technical indicators, a plain-English AI strategy builder, and DCA, grid, futures, copy trading, backtesting, paper trading, and tax reporting on one engine. Stochastic is one of those 15. This is a guide to what it actually calculates, where the textbook 14,3,3 settings fight crypto's volatility, and how to gate it into a rule that survives a real trend instead of trading against it.
Most people asking about this indicator aren't looking for a black-box signal generator. They want something between plug-and-play and write-your-own, and they want to see which specific rule fired, not just trust that something did. Stochastic earns that trust or it doesn't, based on what it's actually measuring, so start there.
What the Stochastic Oscillator Actually Calculates
George C. Lane developed the indicator at Investment Educators in the late 1950s on a simple observation: momentum tends to shift before price does, and closes start clustering near one edge of a range before a reversal shows up on the chart. The math backs that idea directly. %K equals the current close minus the lowest low over the lookback period, divided by the highest high minus the lowest low over that same period, times 100. A %K of 90 means the close landed near the top of the recent range. A %K of 10 means it landed near the bottom.
%D is just a short moving average laid over %K, usually a 3-period simple average, plotted as a signal line. When %K crosses above %D, that's read as bullish. When it crosses below, bearish. The default full setting is 14, 3, 3: a 14-candle lookback, a 3-period smoothing applied to %K before it's plotted, and a 3-period average for %D on top of that.
The 80/20 Bands, and Why Crypto Traders Slow Them Down
The standard read treats a %K above 80 as overbought and below 20 as oversold. That works cleanly in a market that chops sideways most of the time, where a spike into either zone genuinely tends to mean revert. Crypto doesn't chop sideways most of the time. It trends hard, and during a real trend, %K can sit above 80 for days on end while the asset keeps making new highs.
The 14-period lookback has the opposite problem on fast intraday timeframes. Fourteen candles on a 15-minute chart covers three and a half hours, which can lag a sharp crypto move by the time the signal actually crosses. There's no single correct fix. Some traders widen the overbought and oversold bands toward 90 and 10 to cut down on premature exits during strong trends. Others shorten the lookback to catch swings earlier, accepting more noise in exchange for less lag. Those bands were tuned for a market that closes for the weekend. Crypto never got the memo. Test the specific pair and timeframe you trade with the free DCA backtester before committing real size to either adjustment.
One indicator is still just one input. Stochastic, the other 14 built-in indicators, cava-signals, DCA, grid, and futures all run on the same engine. See how the full platform fits together before you size a position off one system alone.
Fast Stochastic, Slow Stochastic, and Stochastic RSI Are Three Different Tools
Fast stochastic is the raw calculation with no extra smoothing on %K, which makes it react to nearly every candle and whipsaw accordingly. Slow stochastic runs a 3-period smoothing over that fast %K before plotting it, which is what most charting platforms show by default, and what most traders mean when they just say "stochastic."
Stochastic RSI is a different animal entirely, even though the name invites confusion. It applies the exact stochastic formula to RSI values instead of raw price, measuring where the current RSI reading sits inside its own recent range. That extra layer makes StochRSI oscillate faster and hit its extremes more often than either version of the price-based stochastic. More signals, more false ones, and a tool best suited to short-term range reads rather than trend confirmation. RSI stays the slower, steadier gauge for that job. Three related indicators, three different jobs, and one chart-tool marketing page that will happily sell you all three as "advanced momentum analysis" without explaining any of it.
Where It Whipsaws: the Same Blind Spot Every Range-Bound Oscillator Has
A %K/%D crossover in the middle of a strong trend isn't a signal. It's the indicator noticing that price briefly pulled back inside its own recent range, then flagging the pullback as a reversal the moment %K and %D cross again on the way back out. In a genuine trend, that produces crossover after crossover in the same direction the trend was already going, each one tempting a trader to take profit or flip position on noise the trend was going to absorb anyway.
The fix is the same one every oscillator like this needs eventually: gate the crossover behind a trend filter, so the signal only counts when the broader direction agrees with it. Waiting for a crossover to happen only inside the 80 or 20 zone helps some. Requiring a separate trend read to confirm direction first helps more, because it stops the bot from treating a healthy pullback in a strong trend as the trend's ending. The crossover fired. The trend never noticed.
Gating a Stochastic Oscillator Strategy Into a Bot Rule
Here's where Stochastic earns its keep over an indicator like Parabolic SAR: it's genuinely one of TradeArmor's 15 built-in indicators, computed locally in real time, not a workaround. That means a gated rule pastes directly into Custom mode today, no code required:
STOCHASTIC_BUY && SUPERTREND_BUY
That formula only takes the stochastic crossover when Supertrend confirms the broader trend is still intact, which filters out most of the whipsaw a raw crossover produces on its own. Hybrid mode can run the same logic as a filter layered on top of the built-in cava-signals instead of a fully custom formula, letting the proven signal pick candidates while Stochastic and Supertrend decide whether the timing actually makes sense. Traders who'd rather describe the rule in a sentence than write the boolean syntax can hand it to the plain-English AI strategy builder, which is bring-your-own-key, so the AI provider is the trader's own and nothing extra gets billed on top.
For a faster momentum read on a shorter timeframe, pairing it with RSI and MACD instead of Supertrend catches earlier turns at the cost of a wider net:
STOCHASTIC_BUY && RSI_BUY
Position Sizing and Exits Still Carry the Weight
A confirmed stochastic entry tells you when to get in. It says nothing about how much capital goes into that entry, whether the position scales in with DCA legs instead of a single full-size buy, or how the trade behaves once a drawdown starts that the indicator never predicted. Entry signals get most of the attention in guides like this one, and sizing quietly decides whether a good entry actually compounds into something or just delays the account's next mistake. Pair the entry logic with a real exit plan, whether that's a fixed trailing take-profit or a stop tied to the same trend filter gating the entry.
None of that changes where the exchange API key running any of it should live. A stochastic crossover, a Supertrend gate, or an RSI filter all execute identically whether the key sits in a vendor's cloud or a local config file on hardware only you control. Only one of those setups keeps the bot restricted to trade permission, never withdrawal, and entirely out of anyone else's reach.
The Honest Summary
The stochastic oscillator measures where a close sits inside its own recent range, on a 14,3,3 default built for markets that close on Fridays. It reads clean in a market that chops and reads misleading in one that trends, which describes most of crypto most of the time. Gate it behind a trend filter like Supertrend or RSI before trusting a crossover, and it becomes a genuinely useful entry timing tool instead of a source of noise. That's the kind of rule TradeArmor was built to run: one self-hosted subscription instead of a chart tool, a signal service, and a SaaS bot stacked on top of each other, with your API keys never leaving your machine. See the plans and get started.
Frequently Asked Questions
What does the stochastic oscillator actually calculate?
It measures where the most recent close sits inside the price range of the last several candles, not whether the market is trending. The %K line is the close minus the lowest low, divided by the highest high minus the lowest low, times 100, calculated over a lookback period that defaults to 14 candles. A %K near 100 means the close landed at or near the top of that range. A %K near 0 means it landed at or near the bottom. The %D line is just a short moving average of %K, usually 3 periods, plotted alongside it as a signal line. George C. Lane developed the indicator at Investment Educators in the late 1950s on the idea that momentum tends to shift before price does, and closes start clustering near one edge of the range before a reversal actually shows up on the chart.
What are the best stochastic oscillator settings for crypto?
The default is 14, 3, 3: a 14-period lookback, a 3-period smoothing on %K, and a 3-period moving average for %D. Those defaults were built for markets that close for the weekend, and crypto never does. On lower timeframes the 14-period window can lag a fast crypto move, which is why some traders shorten the lookback to catch swings earlier, at the cost of more noise. The 80 and 20 overbought and oversold levels are the other lever. In a strong trend, price can pin %K above 80 for days while still climbing, so traders who trade crypto's sharper trends often widen the bands toward 90 and 10 to cut down on premature exits. None of these are universal fixes. Backtest the specific pair and timeframe before trusting a parameter change with real size.
What's the difference between fast stochastic, slow stochastic, and Stochastic RSI?
Fast stochastic is the raw calculation with no extra smoothing on %K, which makes it jumpy and prone to firing on single-candle noise. Slow stochastic takes that fast %K and runs a 3-period smoothing over it before plotting, which is what most platforms show by default and what most traders actually mean when they say stochastic. Stochastic RSI is a different indicator entirely: it applies the stochastic formula to RSI values instead of raw price, measuring where RSI sits inside its own recent range. That makes StochRSI faster and more sensitive than either version of the price-based stochastic, which means more signals and more false ones, while plain RSI stays the slower, steadier read for trend confirmation.
Why does a stochastic oscillator strategy whipsaw so much in a strong trend?
Because %K and %D measure position inside a range, not trend direction, and a real trend keeps sliding that range in one direction. During a strong uptrend, closes keep landing near the top of the recent window, so %K pins near 100 and stays there while price keeps climbing. A trader reading that as overbought exits a winner early. Worse, once %K and %D start crossing back and forth in that pinned zone, each crossover looks like a fresh signal even though nothing about the trend has changed. The standard fix is the same one every range-bound oscillator needs: gate the signal behind a trend filter, so a crossover only counts as a trade when the broader trend actually agrees with it.
Can a self-hosted crypto trading bot trade a stochastic oscillator strategy automatically?
Yes, natively. Stochastic is one of TradeArmor's 15 built-in real-time indicators, computed locally with no external data vendor, and it exposes buy and sell boolean states like every other indicator on the engine. A rule like Stochastic buy and Supertrend buy runs in Custom mode today with no code, gating a stochastic crossover behind a live trend confirmation instead of letting it fire in isolation. Hybrid mode can use the same gate as a filter on top of the built-in cava-signals instead of a fully custom formula. Traders who'd rather describe the rule in a sentence than write the boolean syntax can hand it to the plain-English AI strategy builder, which is bring-your-own-key, so the AI provider is the trader's own and TradeArmor adds no markup on top.